The RSI on MA MT4 indicator combines the RSI and moving averages to identify the trend reversal. It calculates the RSI – Relative Strength Index of two moving averages with different periods. The crossover of these two RSI lines provides the bullish or bearish forex trend signal. Since the indicator smoothes the values of Moving averages using RSI it is able to provide better trend reversal signals.
Features of RSI on MA MT4 Indicator
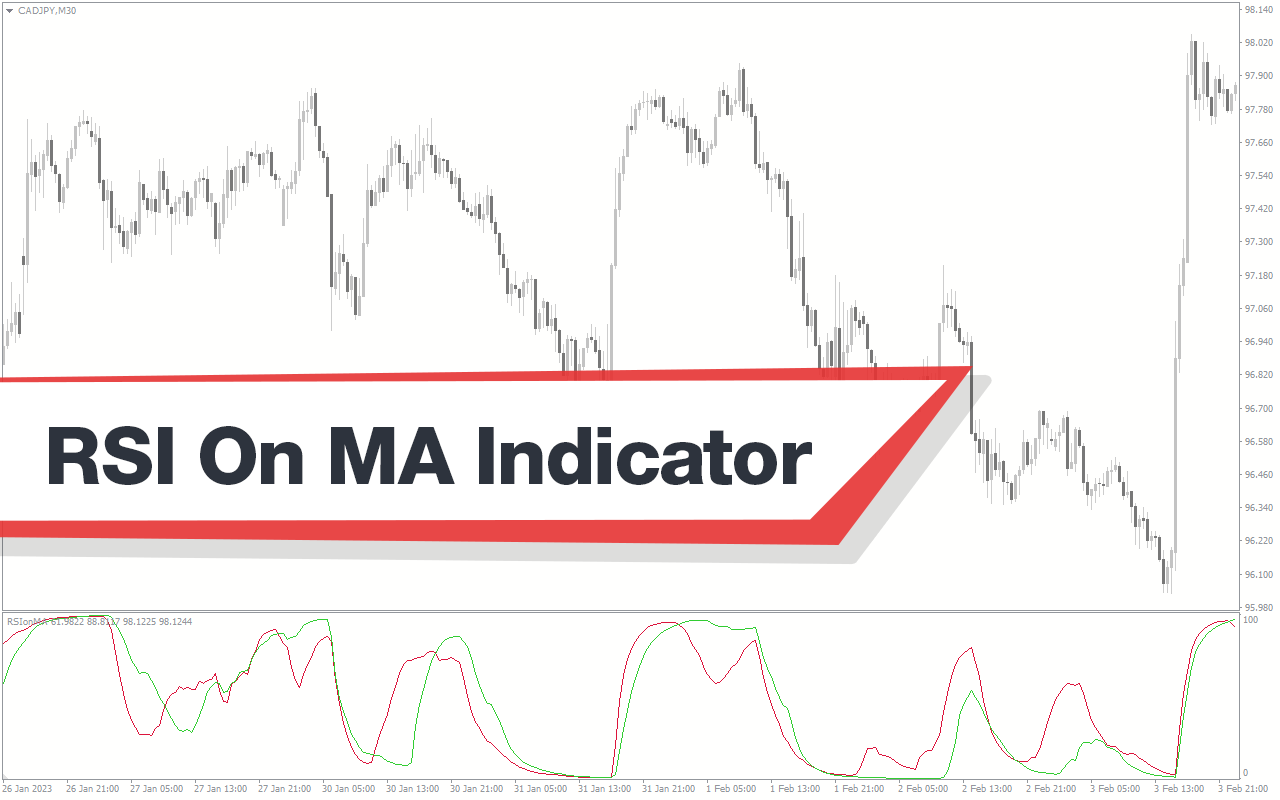
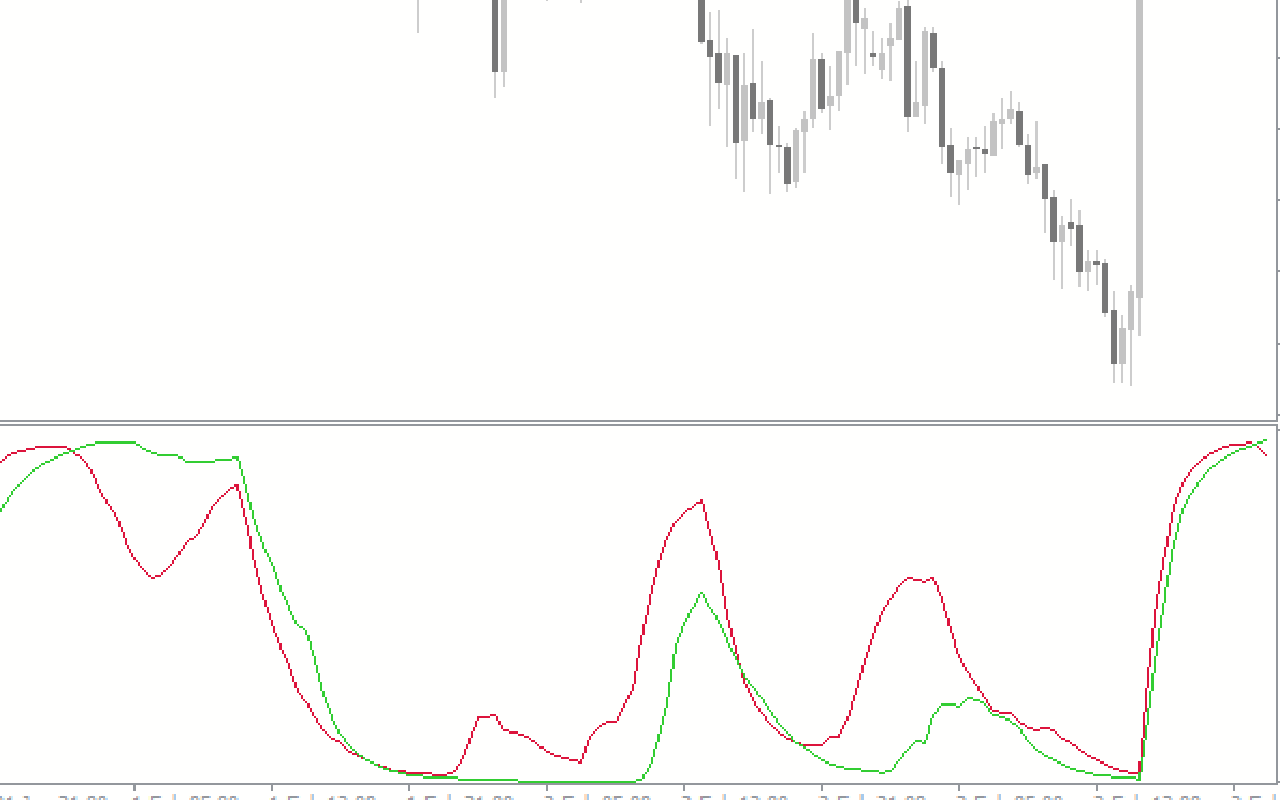
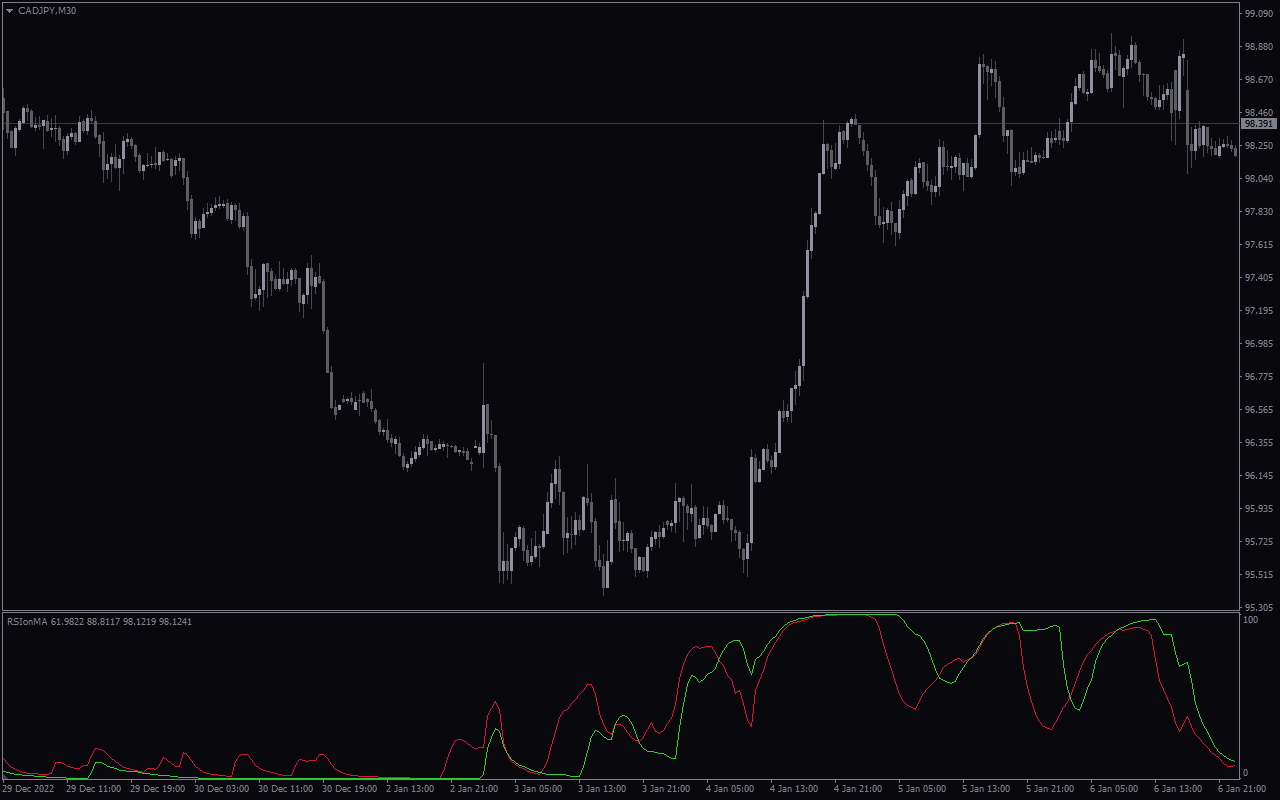
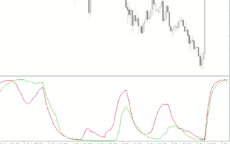
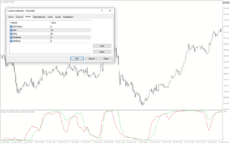
The indicator plots red and green indicator lines on a separate window. The red line represents the RSI of faster moving average, while the green indicates the RSI of slower moving average. Though there are many moving average crossover indicators to identify the trend reversals, this one performs better.
The main feature that differentiates this indicator from the regular moving average crossover is the application of RSI on the MA. As a result, the bullish and bearish signals are much smoother and rewarding.
If the red line crosses the green line upwards, it indicates a bullish trend reversal. Oppositely, the downward crossover of the red line below the green signals the beginning of a downtrend. So, the best trading strategy is to enter the markets using the crossover.
Benefits of RSI on MA MT4 Indicator
This indicator is a simple crossover indicator and is suitable for new and advanced traders. It works perfectly on all chart time frames and is suitable for technical analysis, intraday trading, short and long-term trading.
This oscillator indicator values range from 0 to 100. So traders can add levels at 20 and 80 to identify overbought and oversold conditions. For additional confirmation, traders can filter and enter the market with buy trading signal in an oversold condition. Similarly, traders can open only sell positions in an overbought market.
Indicator Settings Description
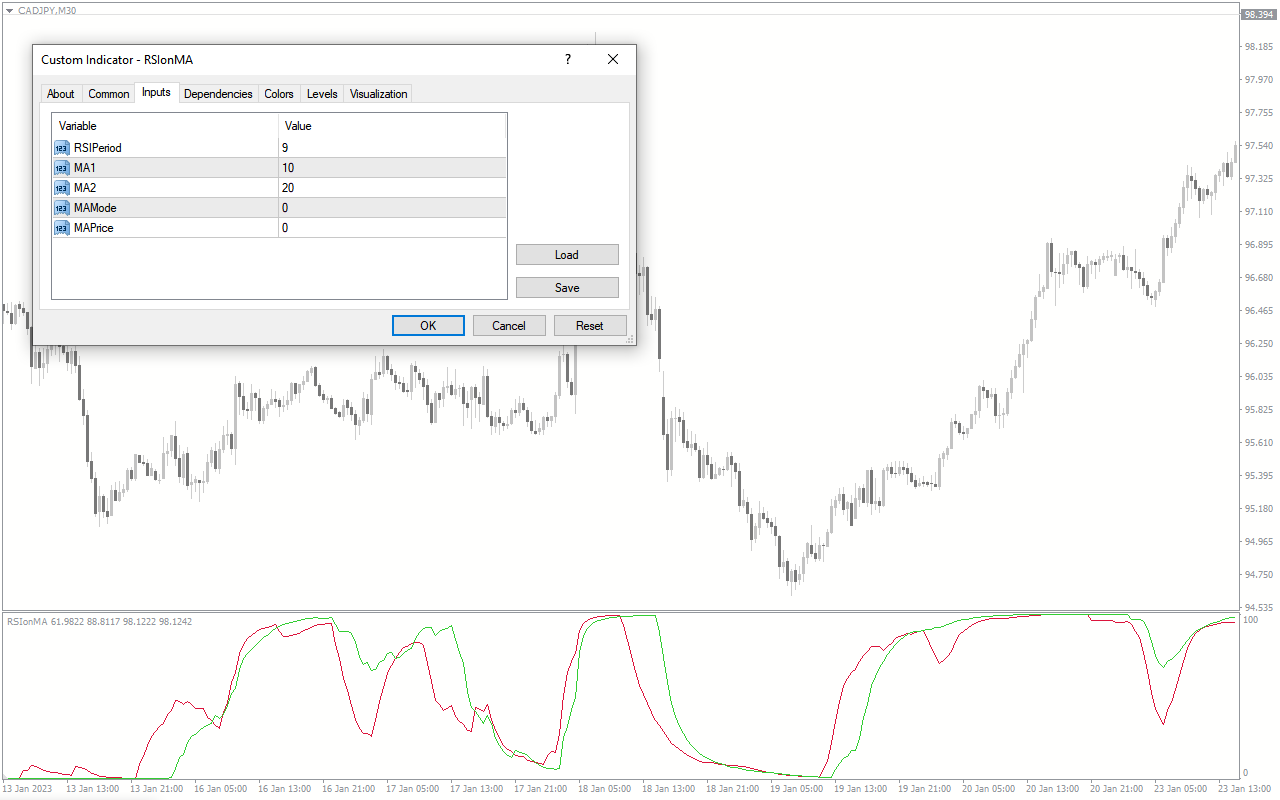
RSIPeriod: Period for RSI calculation.
MA1:, MA2:, MAMode:, MAPrice: Input for moving average calculation.


Reviews
There are no reviews yet.