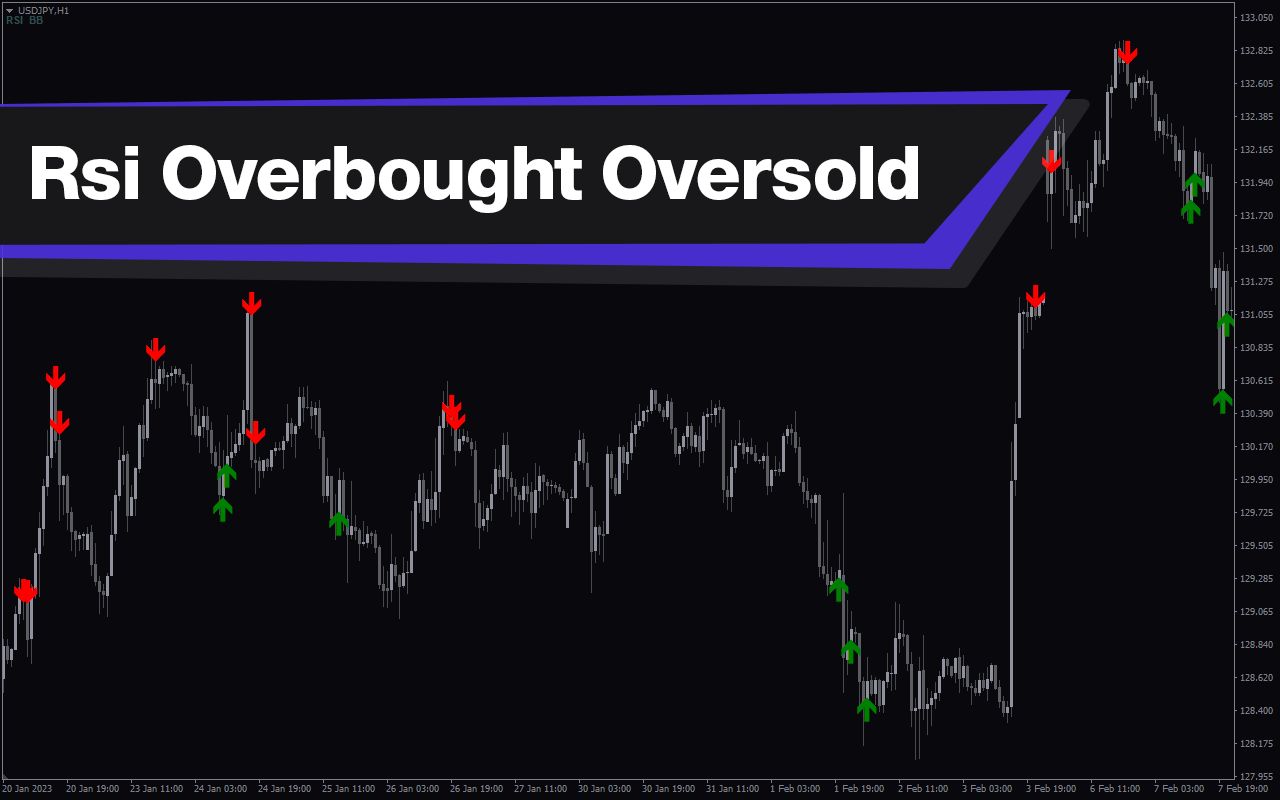
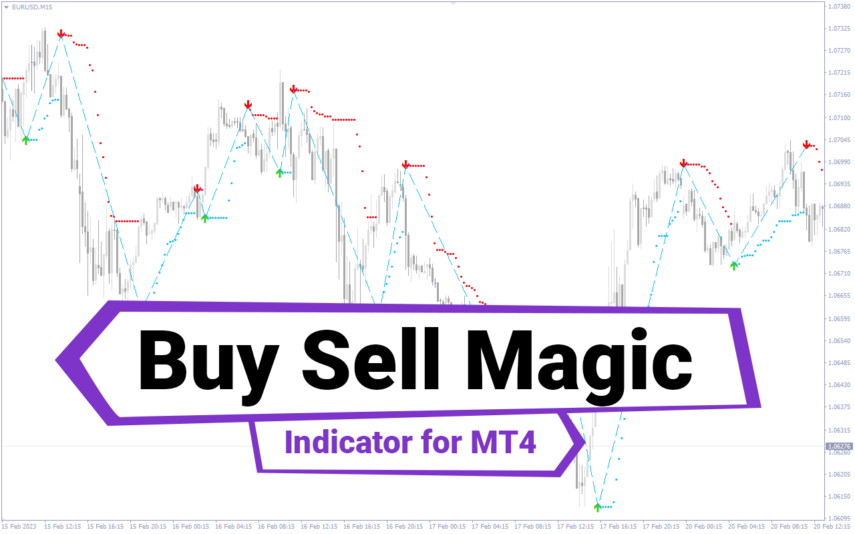
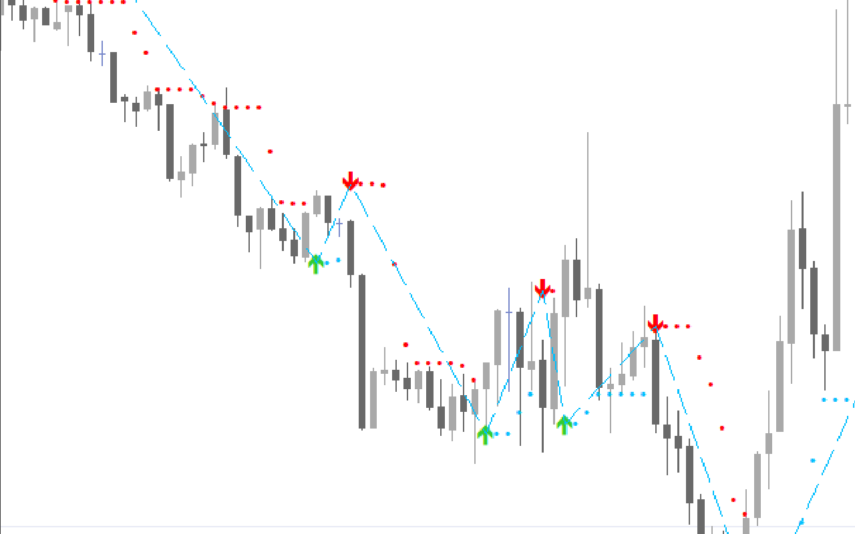
The RSI Overbought Oversold indicator is a trend analysis oscillator that displays BUY or SELL signal arrows when the price is at the overbought/oversold zone of the Relative Strength Indicator (RSI). The GREEN and RED arrows are entry points to BUY/SELL a financial asset.
The RED arrow depicts that the RSI is at the overbought level, suggesting a possible trend reversal to the downside (sell signal). Similarly, the GREEN arrow indicates that the price is at the oversold region of the RSI, suggesting an eminent bullish move (buy signal).
Therefore, this MT4 indicator is one of the best indicators for overbought oversold level detection that helps forex traders identify trend reversal opportunities. However, traders need to confirm the indicator’s signals with price action or any trend analysis tool before buying or selling in the market. Moreover, the RSI Overbought Oversold indicator is chart-friendly, which makes it convenient to use along with other forex indicators.
Features of the Indicator
The RSI Overbought Oversold Indicator oscillates between the 0 to 100 level. A financial asset is overbought when the RSI is above the 70 level, while an oversold asset is when the RSI is below the 30 level.
Furthermore, the indicator doesn’t display the RSI on the screen but paints a RED/GREEN signal arrow when the RSI oscillates to the designated overbought/oversold zone.
Benefits of the Indicator
- Trade Entries/Exits: The indicator’s arrows are clear-cut signals for BUY/SELL trade entries.
- Early Trend Reversal Detector: This indicator detects early trend reversal signals in the market, which helps traders anticipate a move before it happens.
- Trend Confirmation: The indicator is also a suitable tool that can be used as a confluence with other forex indicators to confirm the direction of the market.
Indicator Description Settings
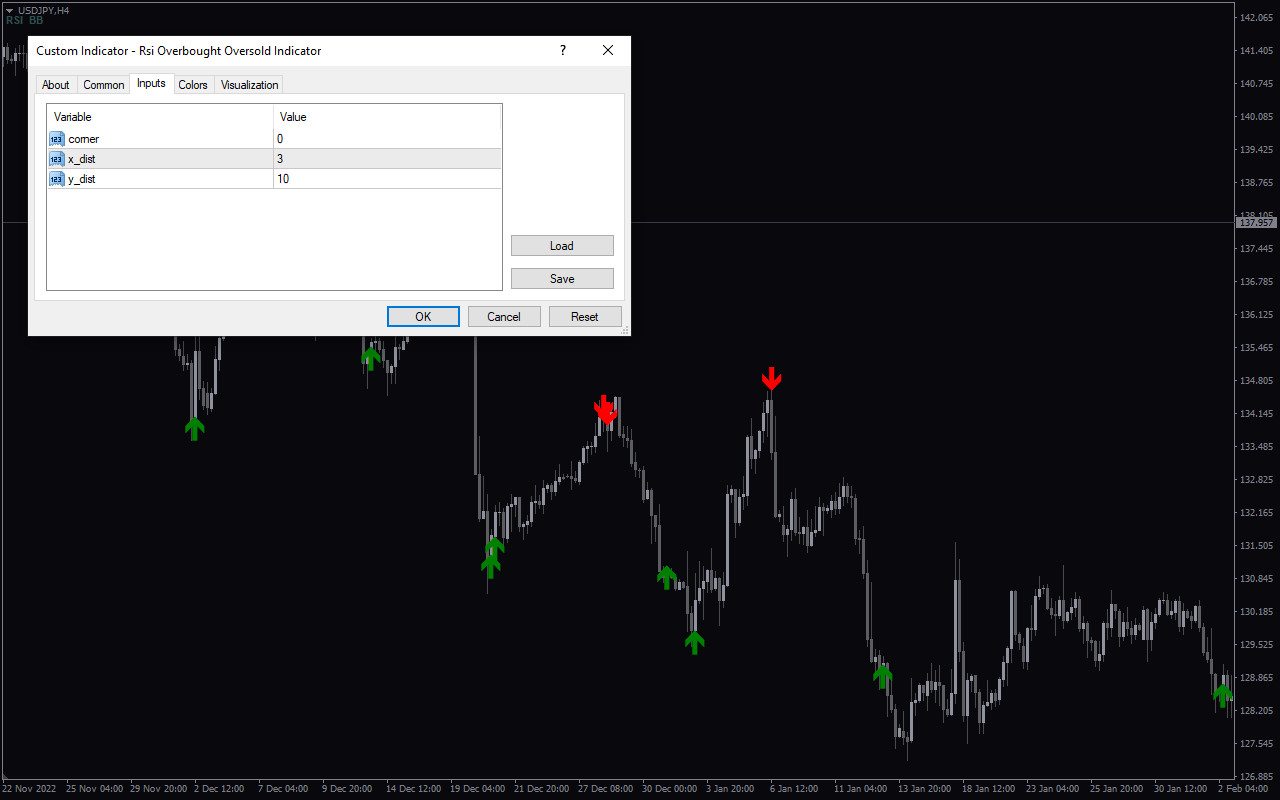
The indicator comes with the following customizable settings:
Corner: This parameter has no noticeable impact on the indicator.
X_dst: Shifts the RSI BB feature along the upper axis of the chart.
Y_dst: Shifts the RSI BB feature along the lower axis of the chart.



Reviews
There are no reviews yet.