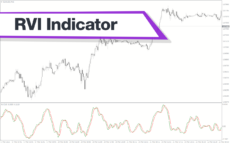
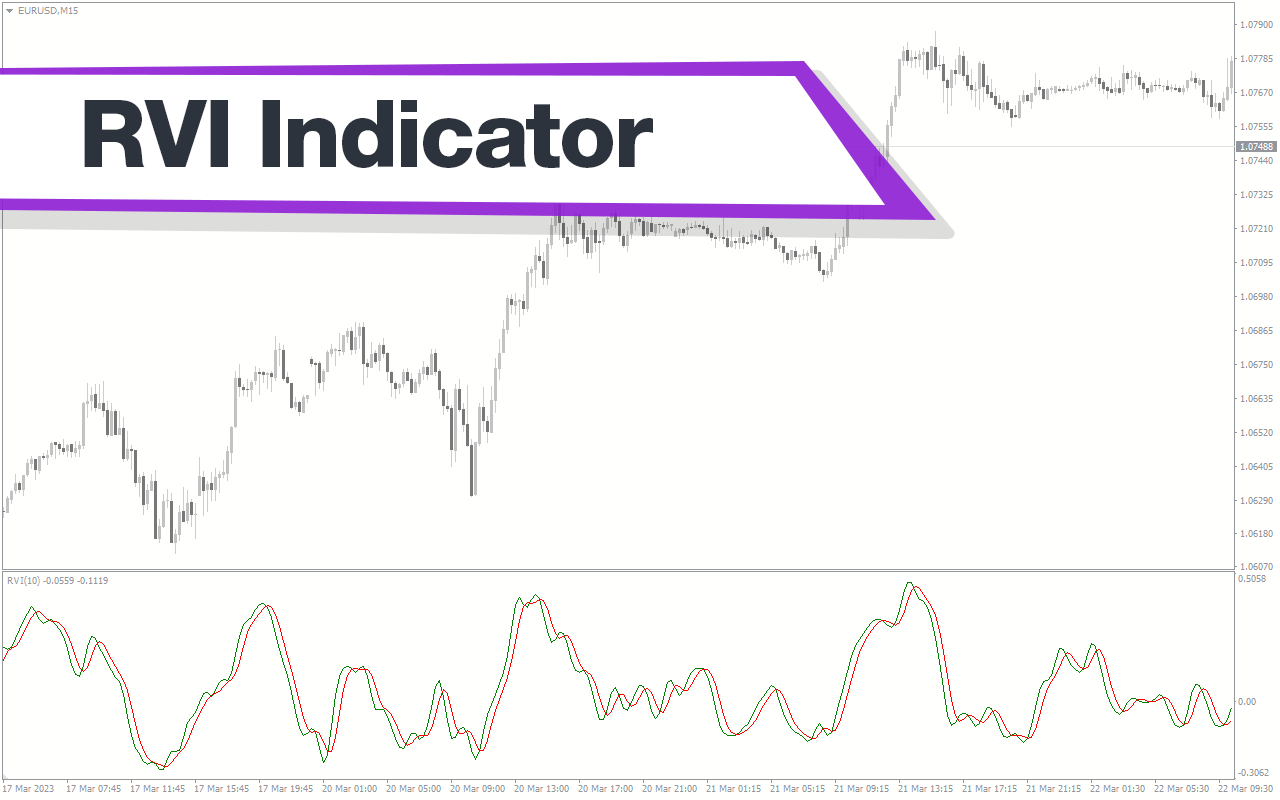
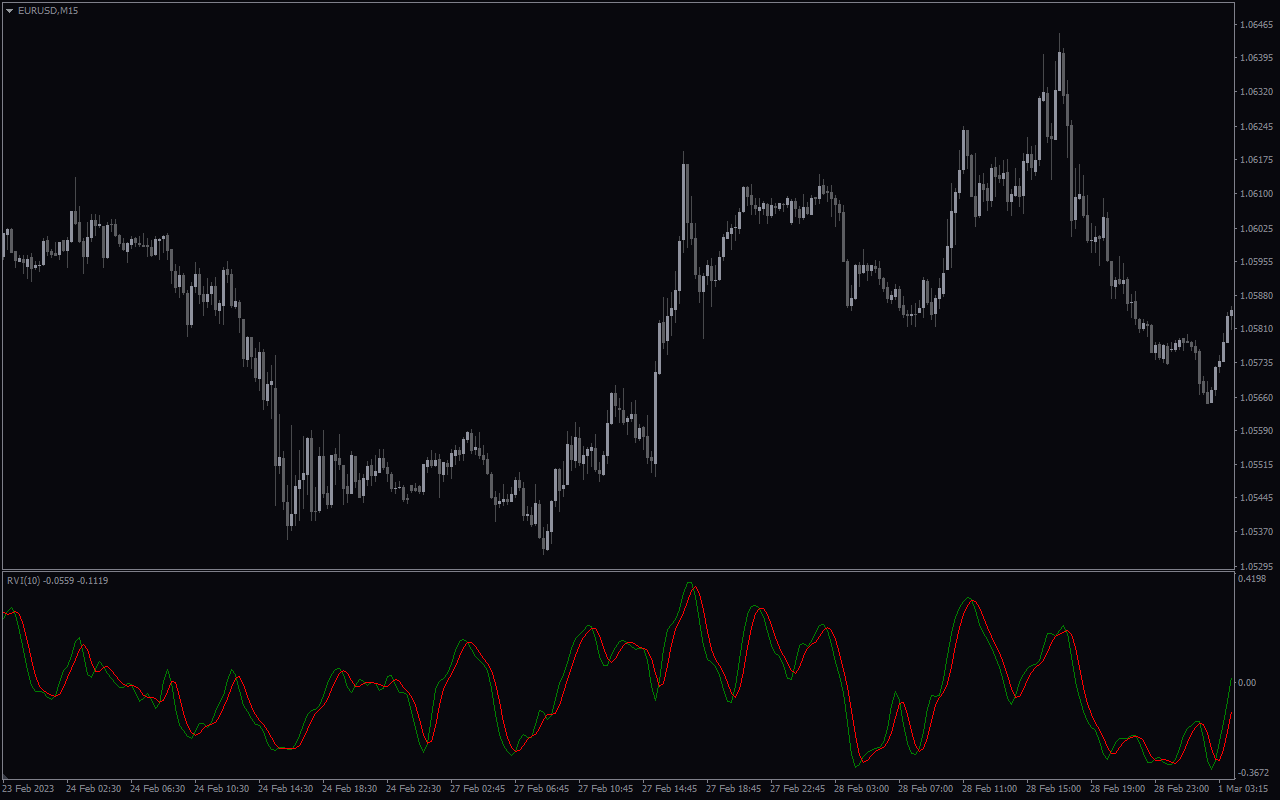
The Relative Vigor Index (RVI) is a useful and popular Forex indicator that can be used to measure the strength of a trend. It is a technical indicator that helps traders identify when the market is overbought or oversold. The RVI is free to download and use on the MetaTrader 4 (MT4) platform. The RVI is based on the concept of relative strength, which measures how much price has moved in a certain period of time. It compares the magnitude of recent gains to recent losses in an attempt to determine whether the current trend is likely to continue. The indicator is calculated by taking the difference between the closing price and the opening price of a given period and then dividing it by the sum of the closing and opening prices. The resulting figure is then plotted on a chart, with a positive reading indicating that the trend is strong and a negative reading indicating that the trend is weak. The RVI is most often used to identify potential reversals in the market. When the indicator is above 70, it indicates that the market is overbought and that a potential reversal is likely. Conversely, when the indicator is below 30, it indicates that the market is oversold and that a potential reversal is likely.
MT4
RVI Indicator
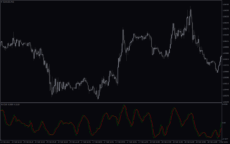
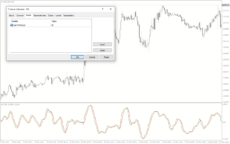
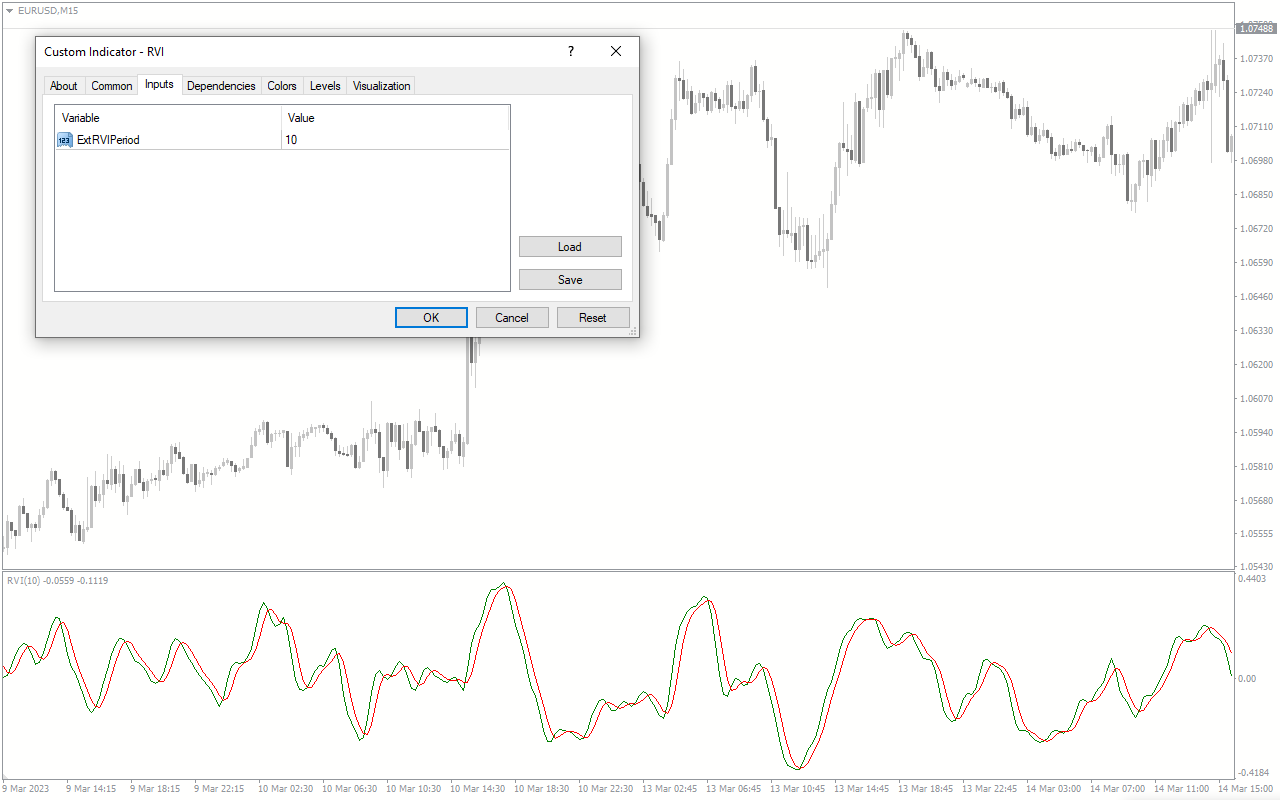
The RVI Indicator is a useful and popular Forex indicator that can be used in the MT4 trading platform. The RVI Indicator measures the difference between the closing prices of a currency pair in a given period of time and then divides it by the sum of the absolute values of the differences. This calculation results in a value that ranges from 0 to 100. A higher value indicates a stronger trend in the market while a lower value indicates a weaker trend. The RVI Indicator is a great tool that can be used to help traders identify potential opportunities in the Forex market.
| Trading Style | |
|---|---|
| Indicator Type | |
| Timeframe | |
| Platform |
0
People watching this product now!
Category: Stochastic
Downloads - 7
Description
Reviews (0)
Be the first to review “RVI Indicator” Cancel reply
How to Install
How install MT4/5 indicator in the terminal?
To install an MT4/5 indicator in the terminal, follow these steps:
Download the indicator file (.ex4 or .mq4/.ex5 or .mq5) to your computer.
Open the MT4/5 terminal and click on “File” in the top left corner.
Select “Open Data Folder” from the dropdown menu.
In the window that opens, double-click on the “MQL4/5” folder.
Double-click on the “Indicators” folder.
Drag and drop the indicator file from your computer into the “Indicators” folder.
Close the data folder window and restart the MT4/5 terminal.
The indicator should now be available in the “Navigator” window on the left-hand side of the terminal. Simply double-click on the indicator to add it to a chart.
Note: If the indicator is in a .zip file, you will need to extract it first before following the above steps.
And if asks to confirm DLL?
If the indicator you are installing requires access to external Dynamic Link Libraries (DLLs), you may see a pop-up message asking you to confirm the use of DLLs.
DLLs are external libraries that contain code that can be used by other programs. In the case of MT4/5 indicators, they are often used to perform complex calculations or connect to external data sources.
If you trust the source of the indicator and want to use it, click “Yes” to confirm the use of DLLs. If you are not sure or do not trust the source, click “No” to cancel the installation.
It’s worth noting that some indicators may not work properly without access to their required DLLs. If you choose not to allow access to DLLs and the indicator does not work as expected, you may need to reinstall the indicator and confirm the use of DLLs to get it to work properly.
Related products
Volatility Quality
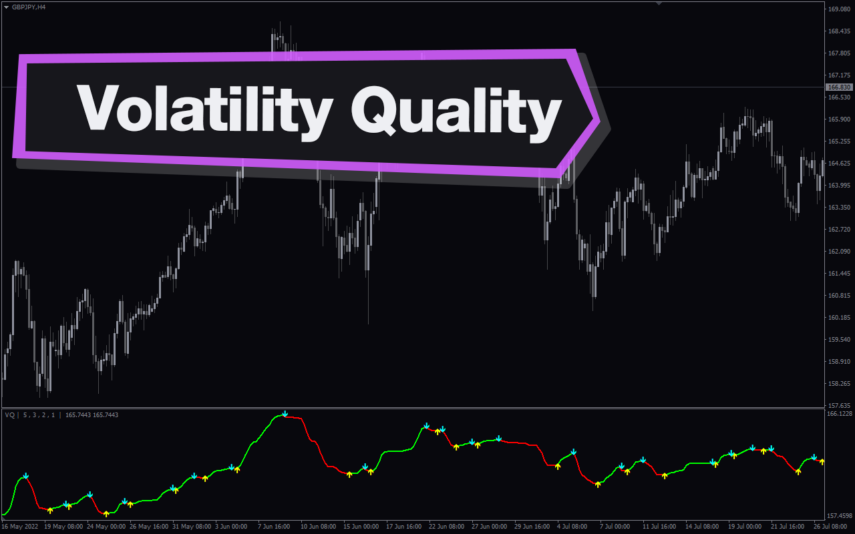
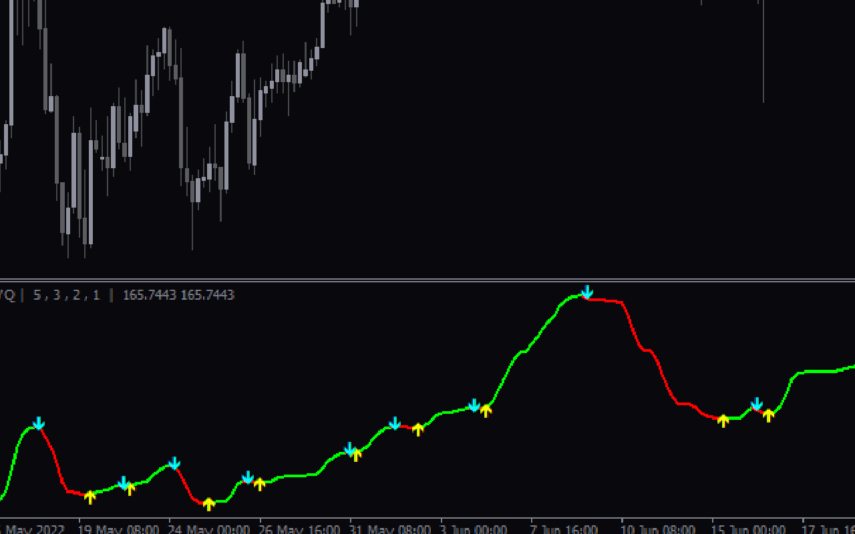
The Volatility Quality Indicator is a useful and popular free Forex indicator for MT4 that helps traders identify the best entry and exit points in the market. This indicator is based on the ratio of the price range of a given period to the average true range of the same period. It helps traders determine the quality of the volatility of a currency pair. It is also a great tool for identifying support and resistance levels. The Volatility Quality Indicator is a great way to make informed decisions when trading Forex.
Woodies CCI Arrows Oscillator
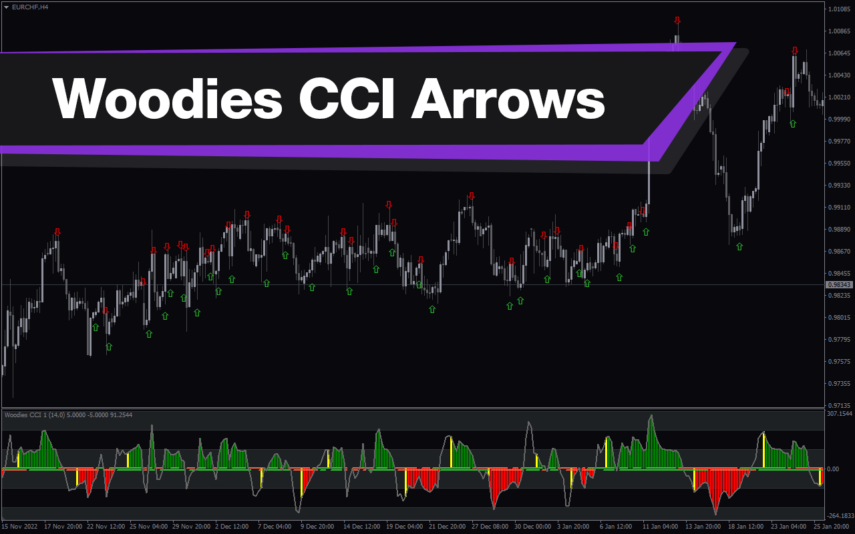
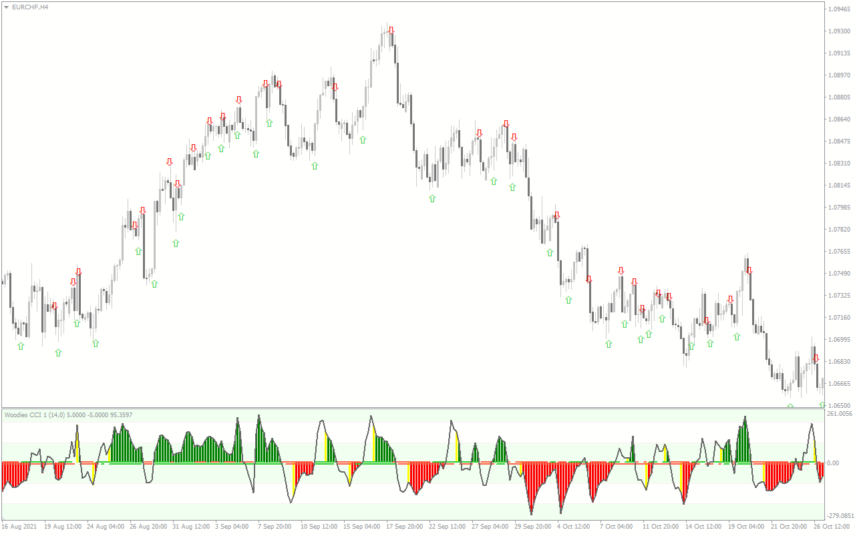
The Woodies CCI Arrows Oscillator Indicator is a popular MT4 technical analysis tool used by forex traders to identify trends and potential entry and exit points wich based on the Woodies CCI system, which helps traders to identify when a trend is strong and when it may be weakening. The arrows on the indicator show when the price is moving in a particular direction, and the oscillator provides additional confirmation of the trend's strength. The Woodies CCI Arrows Oscillator Indicator is a valuable addition to any trader's toolkit, and it can help traders make better-informed trading decisions.
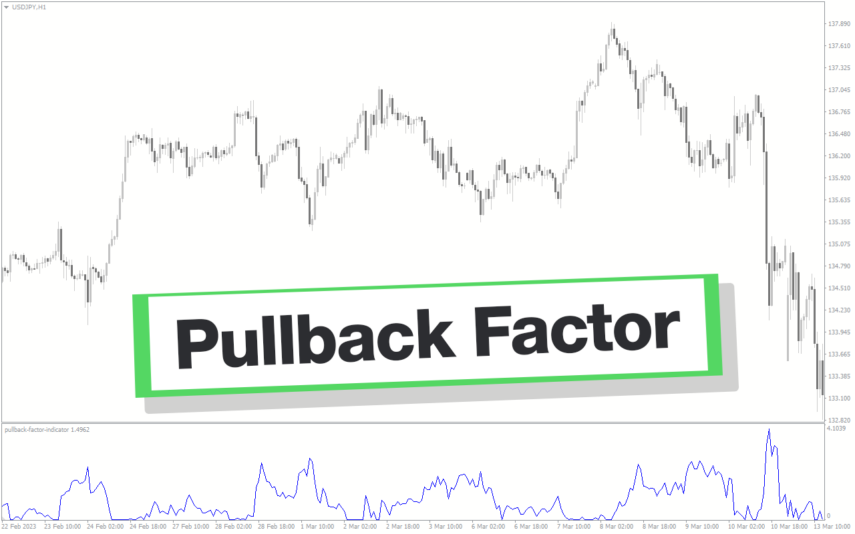
Pullback Factor
Pullback Factor Indicator is a popular and new trend-following indicator designed for use in the forex market. It helps you to identify the end of a trend retracement and the resumption of the trend. With its unique algorithm, the indicator predicts the extent of a trend pullback, enabling traders to enter the market with precision and accuracy.
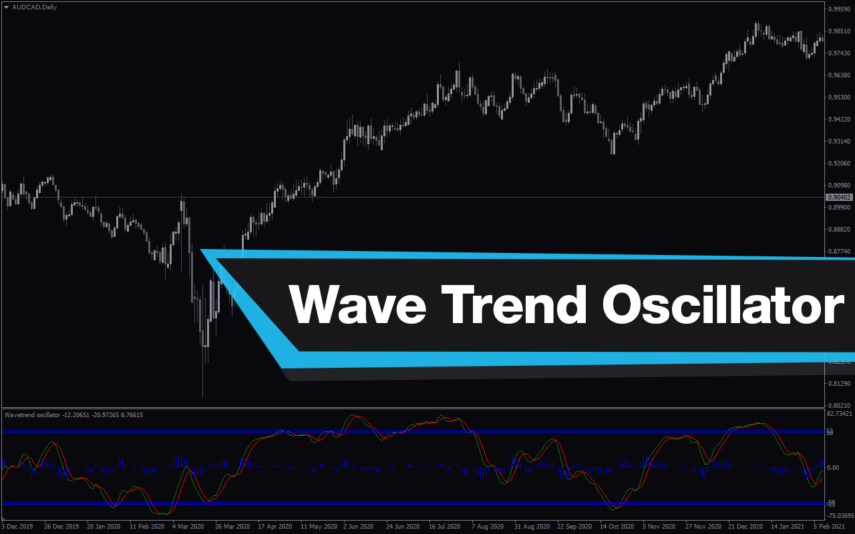
Wave Trend Oscillator
The Wave Trend Oscillator Indicator is a popular and free Forex indicator for MT4 that is useful for both novice and experienced traders. This indicator is designed to detect the trend and momentum of the market and provide traders with a visual representation of the trend direction. It then plots the waves on a chart and provides traders with a signal when the trend has reversed or is about to reverse. This indicator is also customizable, allowing traders to adjust the sensitivity of the indicator to their own trading style. With the Wave Trend Oscillator Indicator, traders can easily identify the trend of the market and make informed trading decisions.
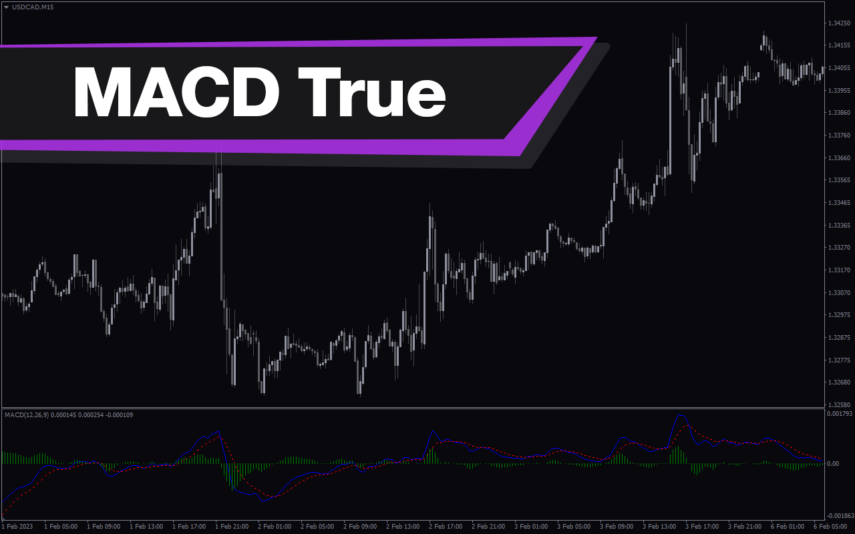
MACD True
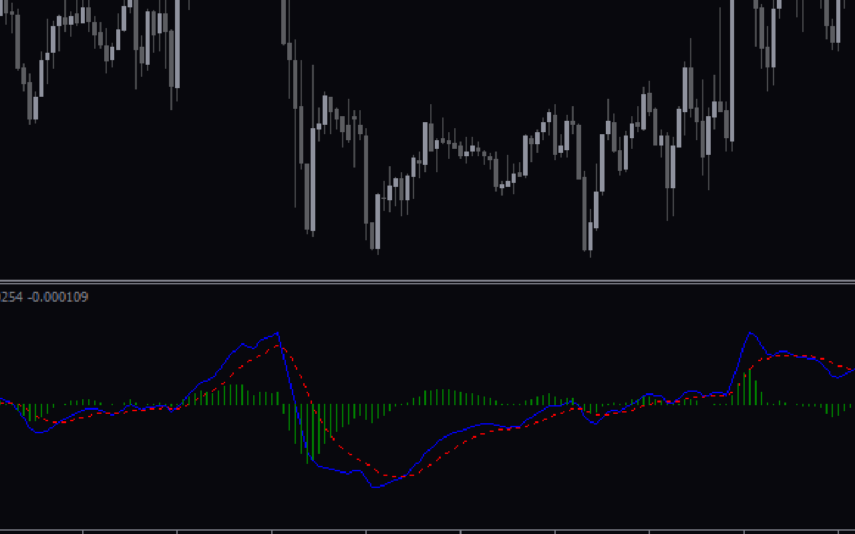
The MACD True Indicator is a popular and useful MT4 forex indicator that helps traders identify trends and momentum in the market. It is a modified version of the traditional MACD indicator that incorporates a color-coded histogram to provide more visual cues for traders. This indicator works by measuring the difference between two moving averages, and it is often used in conjunction with other technical indicators to confirm trading signals. Traders of all levels can benefit from using the MACD True Indicator in their trading strategies.

Reviews
There are no reviews yet.