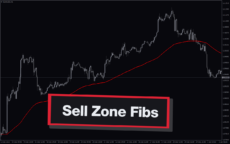
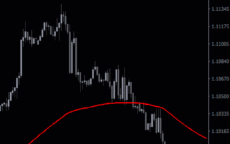
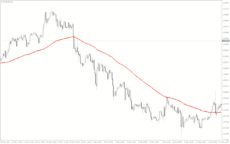
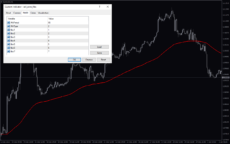
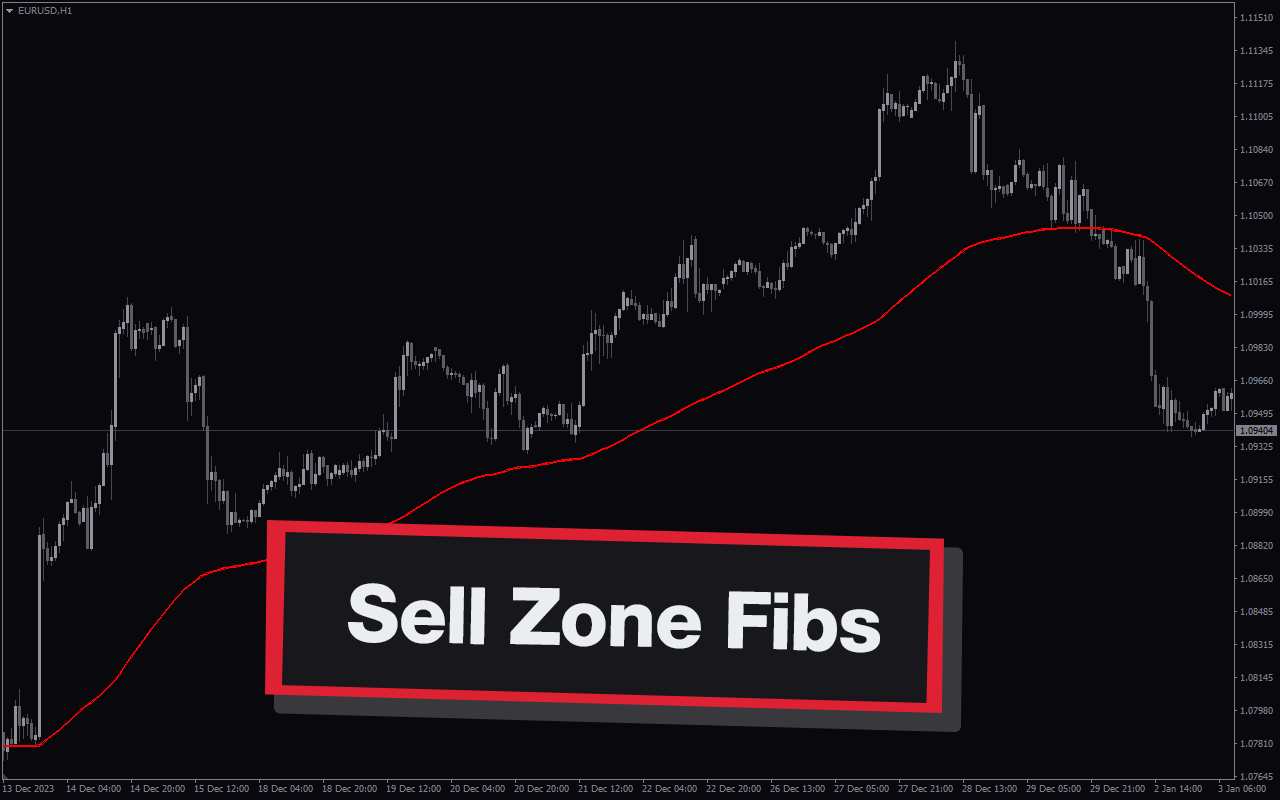
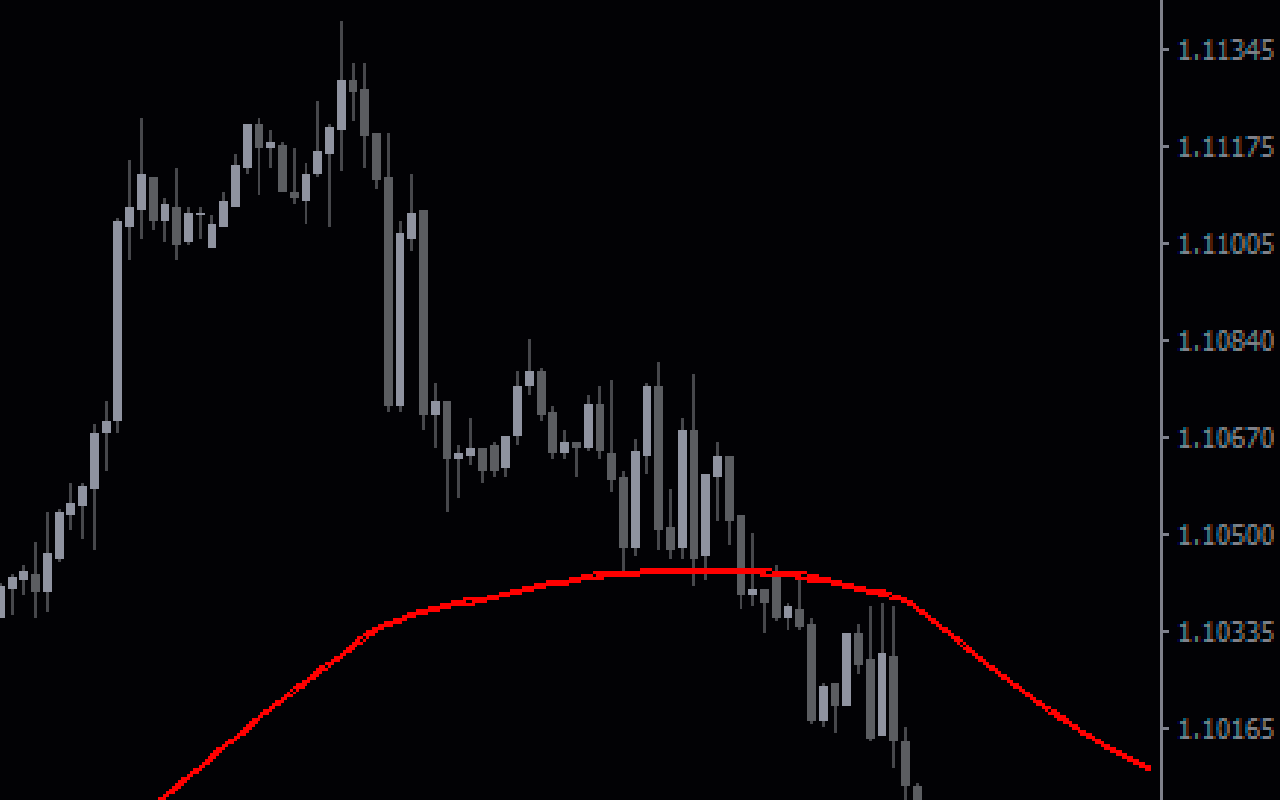
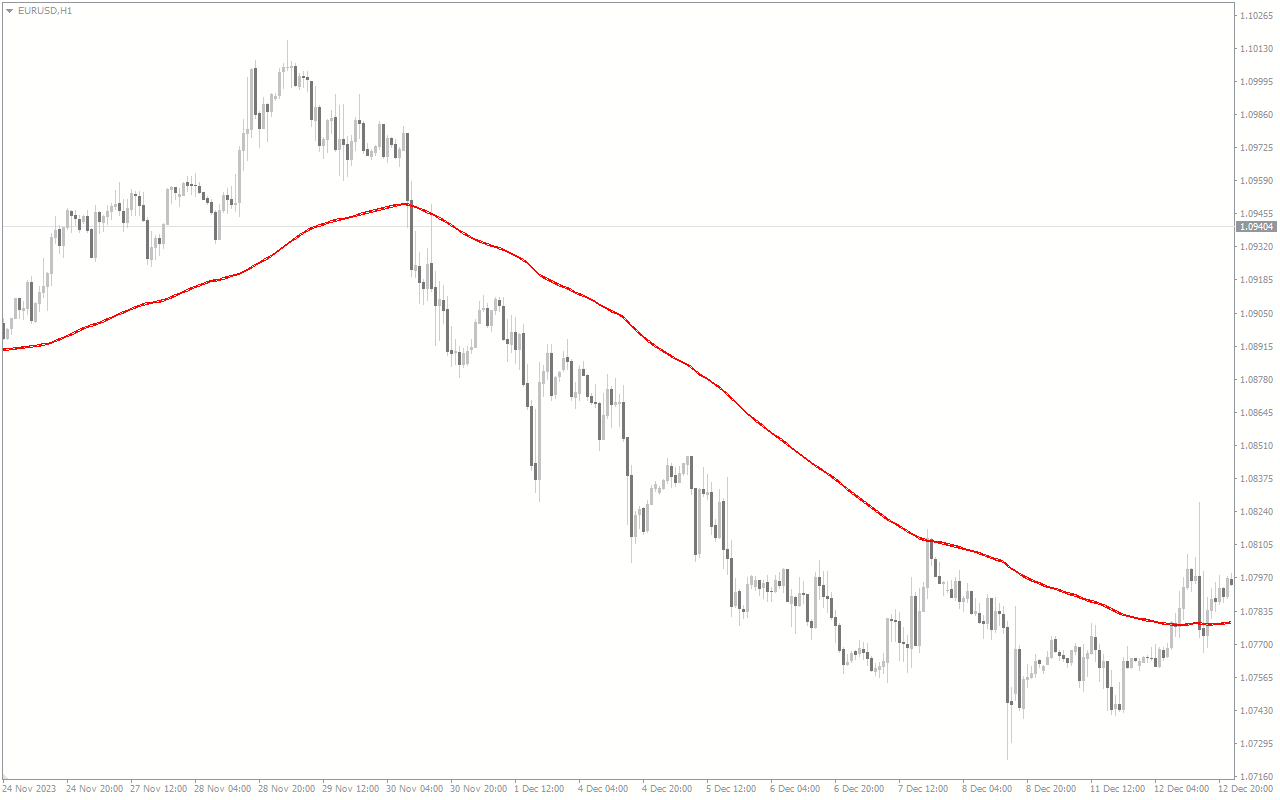
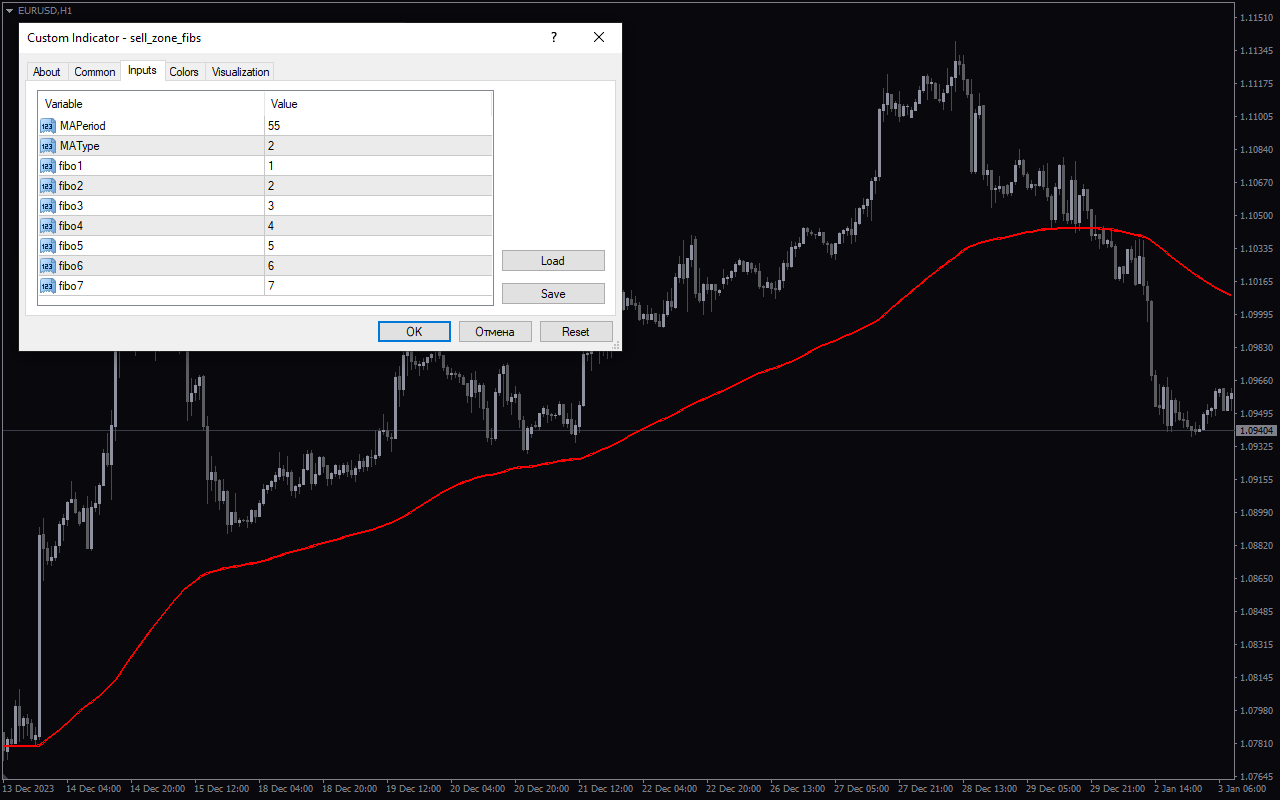
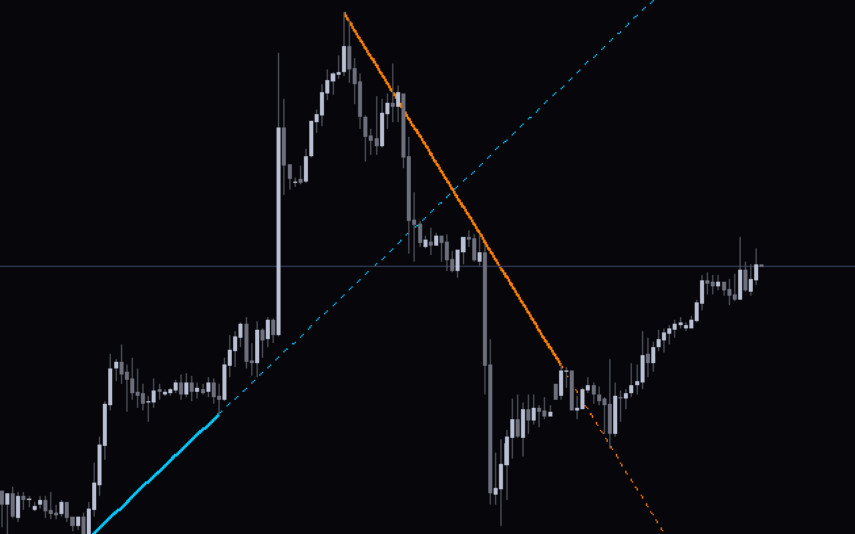
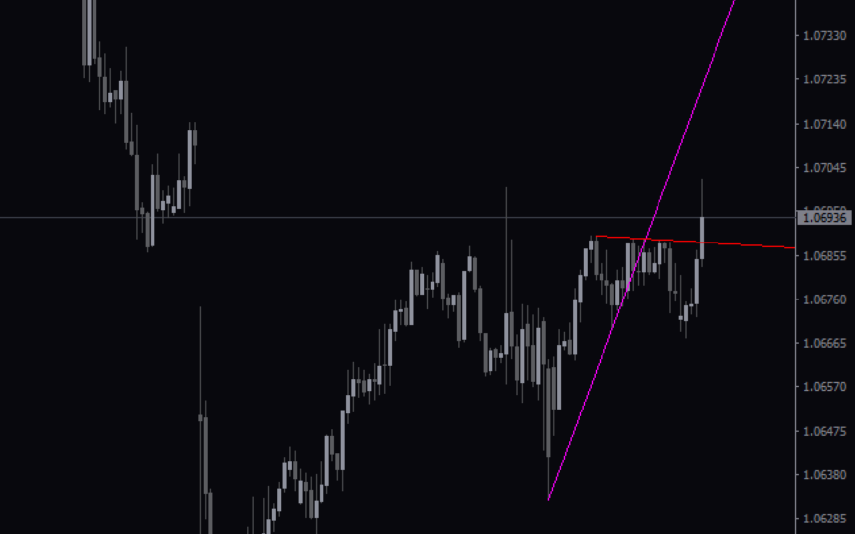
The Sell Zone Fibs indicator is a useful forex tool designed for the popular MT4 platform. Being a free indicator, it provides valuable insights to traders looking to enhance their trading strategies. With its easy-to-understand interface, traders can identify potential selling zones in any forex market. The indicator utilizes Fibonacci retracement levels to determine these sell zones. By analyzing price action and identifying significant highs and lows, it accurately marks areas where selling pressure could potentially occur. Traders can use this information to set profit targets, identify potential reversals, or even plan their entries and exits. To use the Sell Zone Fibs indicator, traders simply need to attach it to their MT4 charts. The indicator then automatically plots the Fibonacci levels and displays the sell zones on the chart. This visual representation makes it easier for traders to spot potential selling opportunities and make informed trading decisions.
MT4
Sell Zone Fibs
Sell Zone Fibs Indicator is a popular and useful forex indicator for MT4. It is available for free and offers valuable insights for traders. This indicator identifies key sell zones based on Fibonacci retracement levels, allowing users to anticipate potential market reversals and make informed trading decisions. By analyzing price patterns, it helps traders determine optimal entry and exit points. With its simple yet effective functionality, Sell Zone Fibs Indicator is a valuable tool for forex traders.
| Indicator Type | |
|---|---|
| Trading Style | , |
| Timeframe | , |
| Platform |
0
People watching this product now!
Category: Trend
Downloads - 26
Description
Reviews (0)
Be the first to review “Sell Zone Fibs” Cancel reply
How to Install
How install MT4/5 indicator in the terminal?
To install an MT4/5 indicator in the terminal, follow these steps:
Download the indicator file (.ex4 or .mq4/.ex5 or .mq5) to your computer.
Open the MT4/5 terminal and click on “File” in the top left corner.
Select “Open Data Folder” from the dropdown menu.
In the window that opens, double-click on the “MQL4/5” folder.
Double-click on the “Indicators” folder.
Drag and drop the indicator file from your computer into the “Indicators” folder.
Close the data folder window and restart the MT4/5 terminal.
The indicator should now be available in the “Navigator” window on the left-hand side of the terminal. Simply double-click on the indicator to add it to a chart.
Note: If the indicator is in a .zip file, you will need to extract it first before following the above steps.
And if asks to confirm DLL?
If the indicator you are installing requires access to external Dynamic Link Libraries (DLLs), you may see a pop-up message asking you to confirm the use of DLLs.
DLLs are external libraries that contain code that can be used by other programs. In the case of MT4/5 indicators, they are often used to perform complex calculations or connect to external data sources.
If you trust the source of the indicator and want to use it, click “Yes” to confirm the use of DLLs. If you are not sure or do not trust the source, click “No” to cancel the installation.
It’s worth noting that some indicators may not work properly without access to their required DLLs. If you choose not to allow access to DLLs and the indicator does not work as expected, you may need to reinstall the indicator and confirm the use of DLLs to get it to work properly.
Related products
VWAP Bands
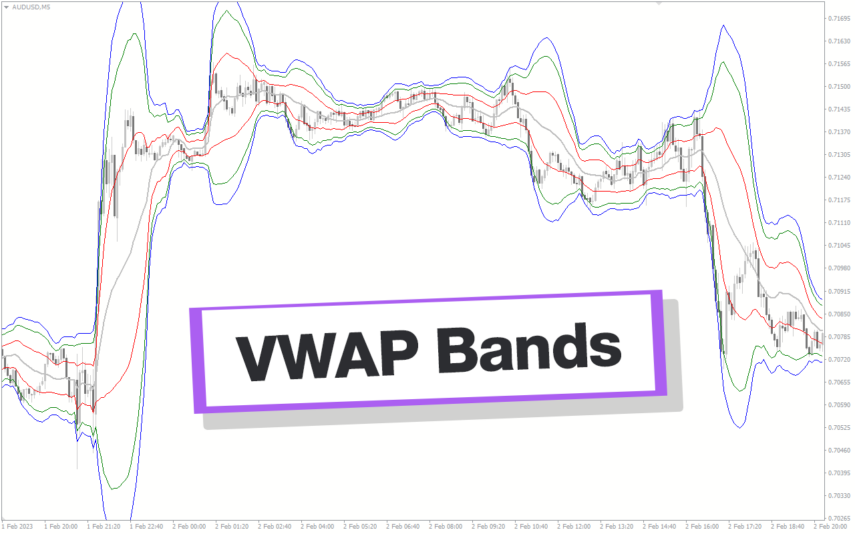
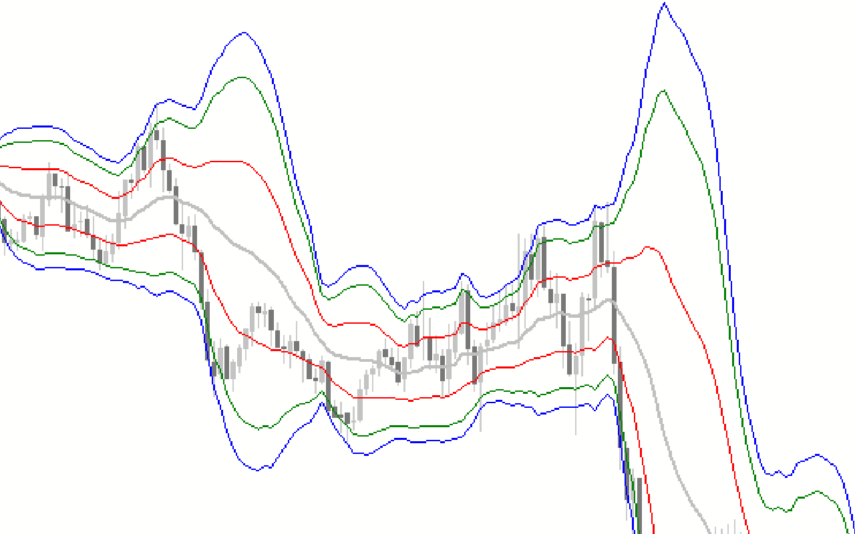
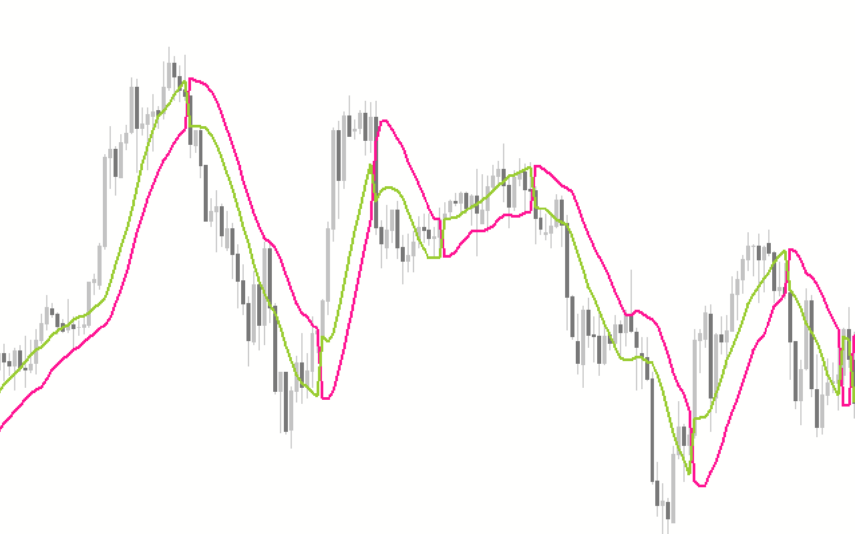
Discover the power of the VWAP Bands indicator, which emphasizes volume in its calculation. Gain insights into support and resistance levels, fair value, and trading opportunities. Suitable for all traders, this versatile Metatrader Indicator allows customization across various time frames with adjustable settings for better trading.
FX Sniper
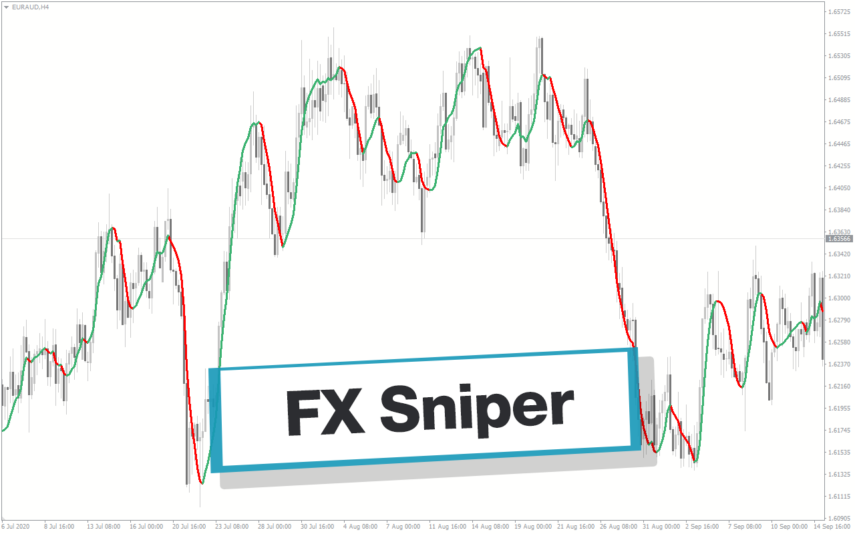
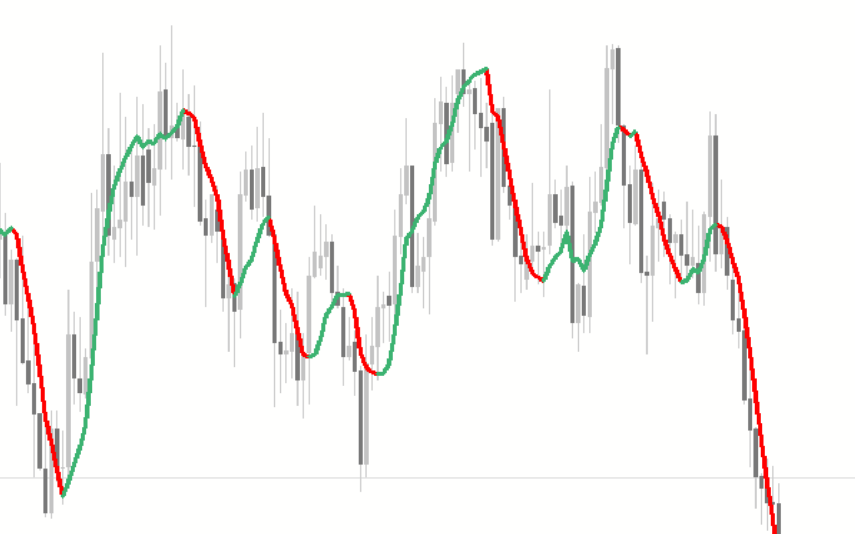
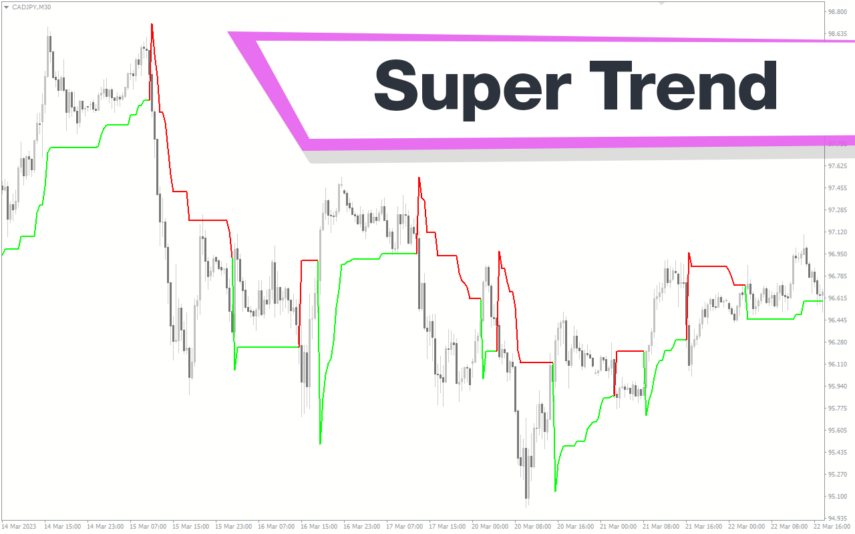
The FX Sniper indicator is a new and popular forex indicator available for free on the MT4 platform. It uses advanced algorithms to identify trends and potential trading opportunities. The indicator is easy to use and gives clear signals on when to buy or sell based on market conditions. The FX Sniper indicator is suitable for traders of all levels, from beginners to experienced traders who want to improve their trading performance and profitability.
Trend Magic
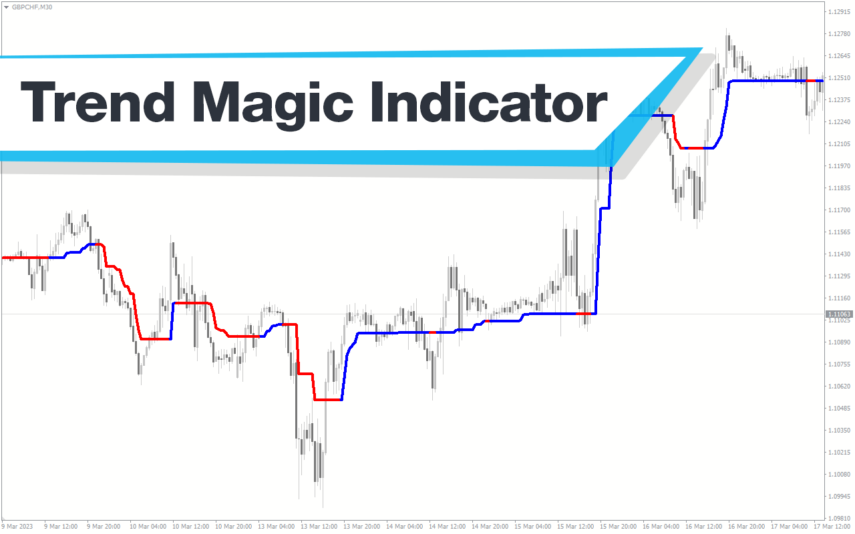
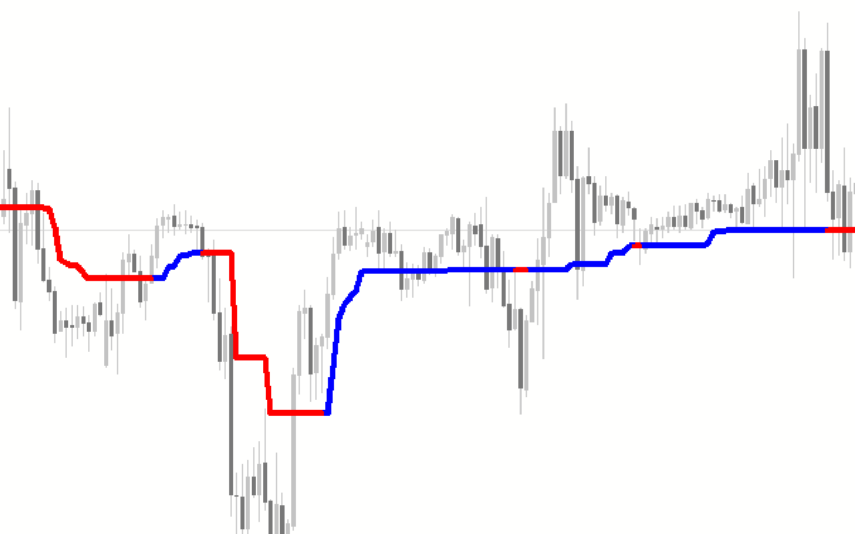
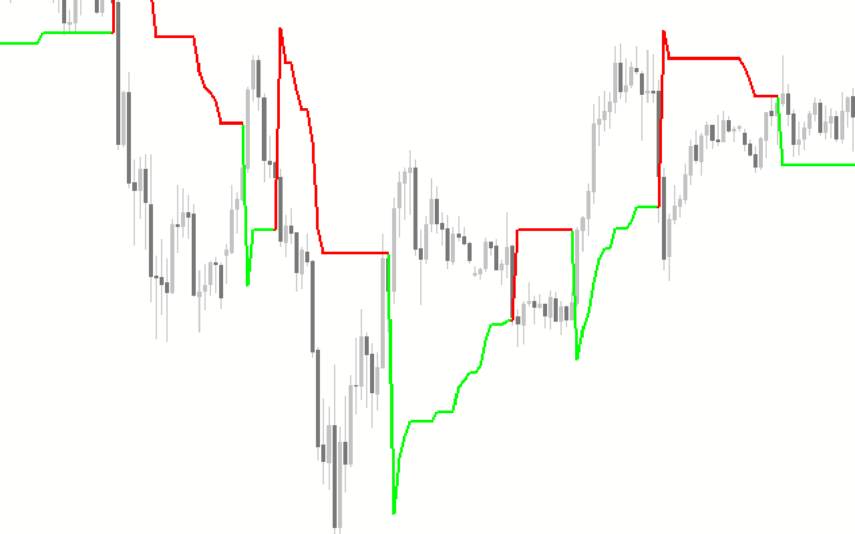
The Trend Magic Indicator is a popular, free forex MT4 indicator that uses a combination of moving averages and filters to identify the trend direction and potential trade opportunities. The indicator appears as a line that changes color according to the current trend direction. The green color indicates a bullish trend, while the red color indicates a bearish trend. It is simple to use and can be a valuable tool for traders to identify potential entry and exit points in the market.
Automatic Trendlines
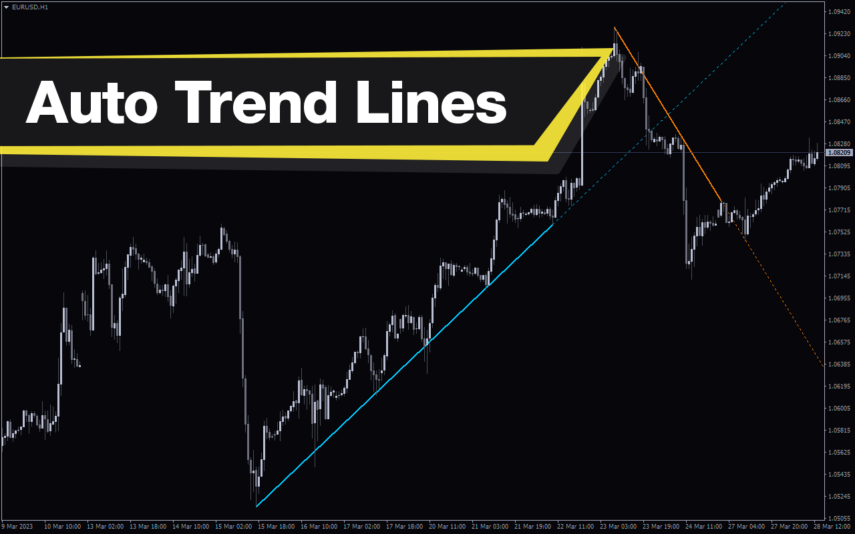
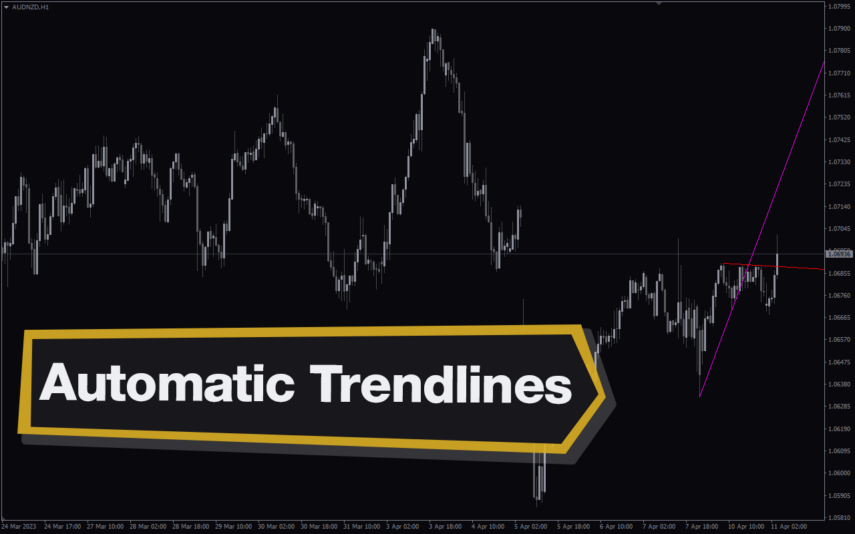
The Automatic Trendlines indicator is a new and popular free to use MT4 indicator designed to automatically draw trendlines on your chart, saving you time and effort. The indicator uses advanced algorithms to determine trendlines based on price movement and can be used on any currency pair or timeframe. The Automatic Trendlines indicator is a useful tool for traders who want to quickly and easily identify trends in their charts.


Reviews
There are no reviews yet.