Features of the Sentiment Histogram Indicator
The Sentiment Histogram indicator for MT4 makes it easier for traders to identify the direction of the market as it shows the current sentiment. Therefore, they can spot reversals or trade with the prevailing trend.
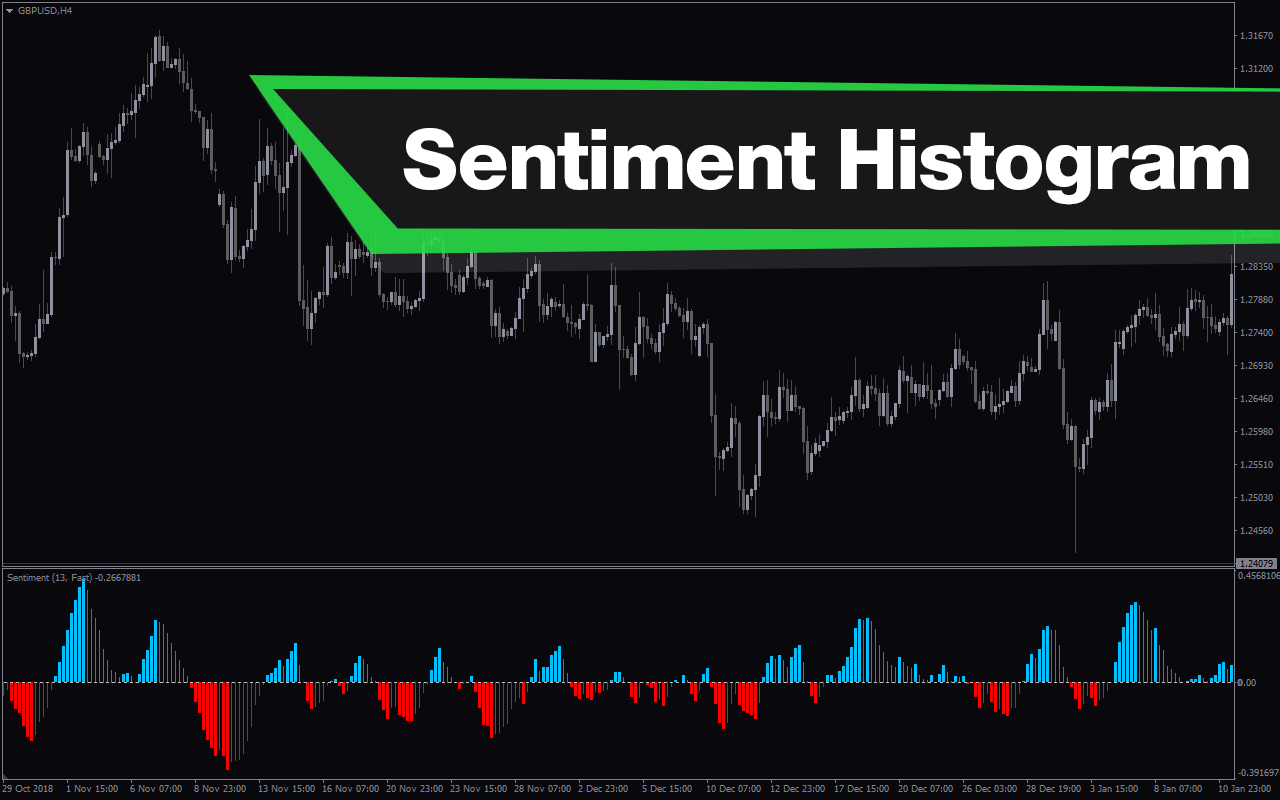
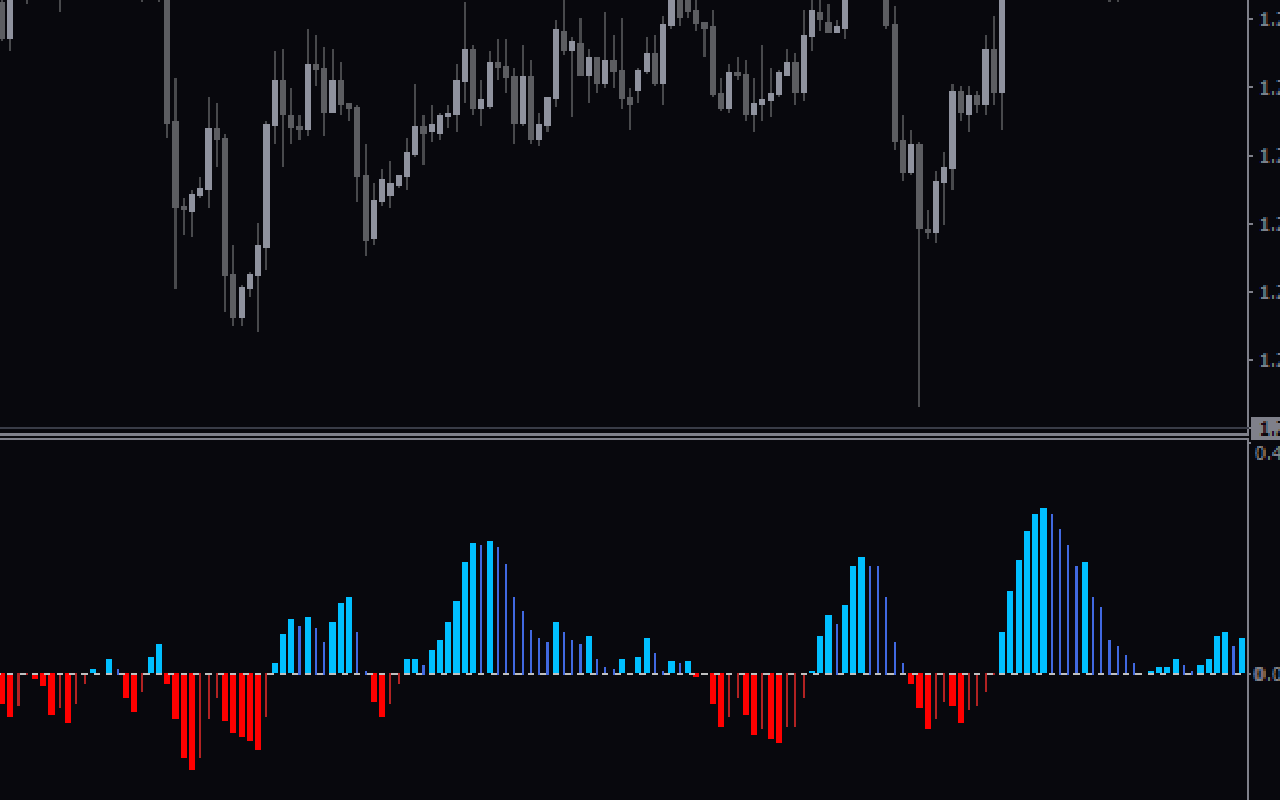
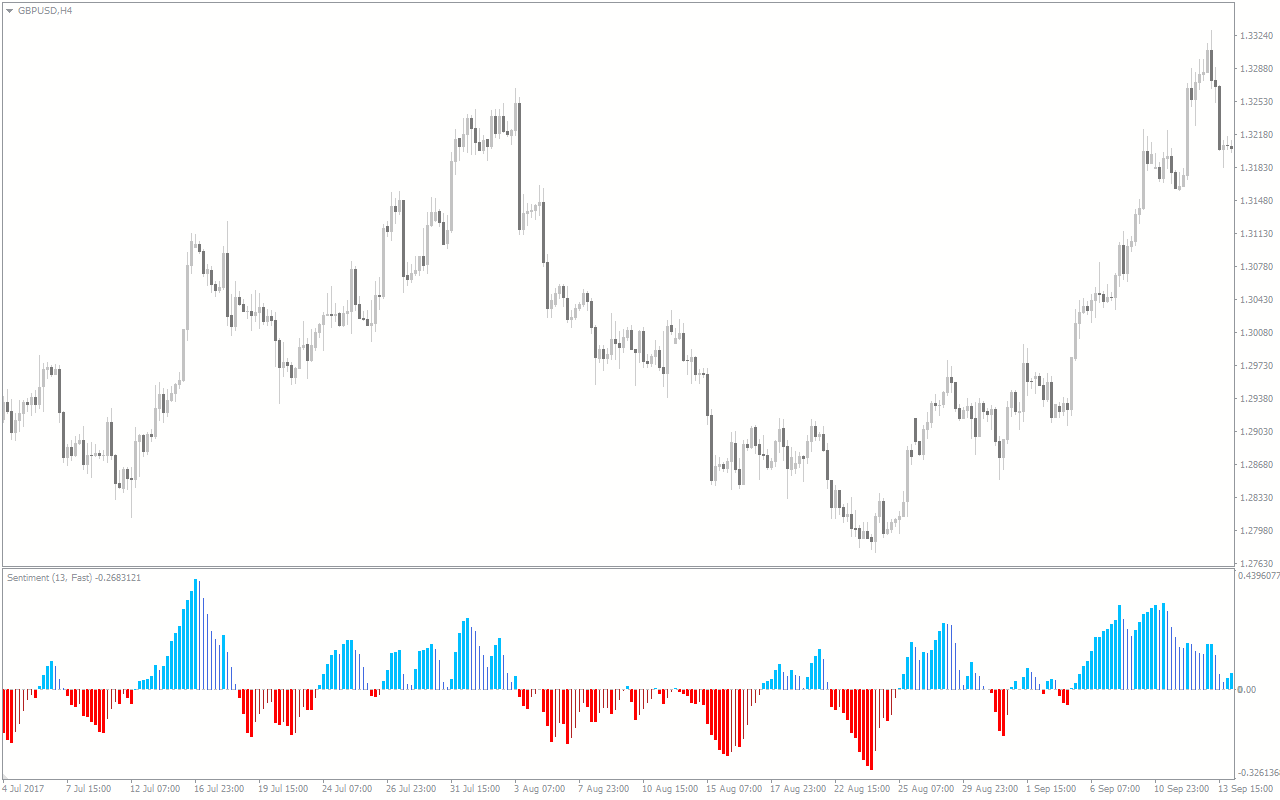
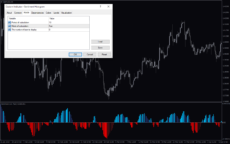
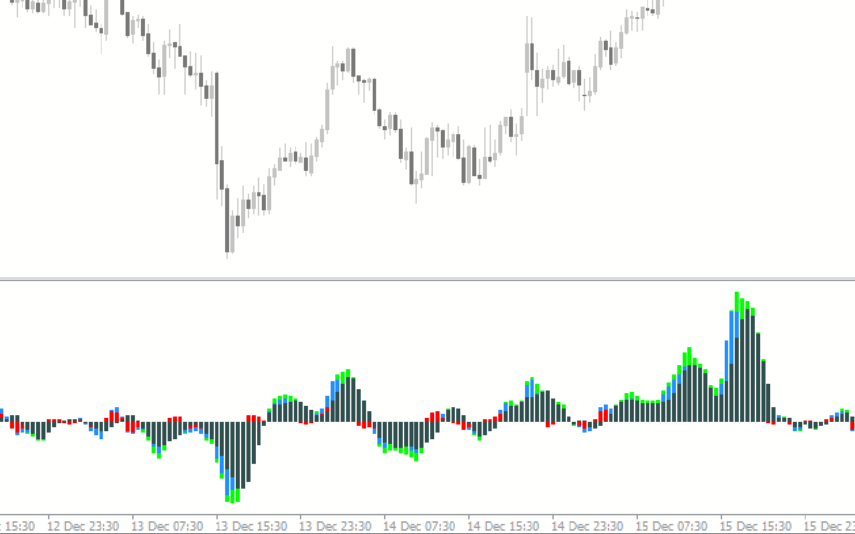
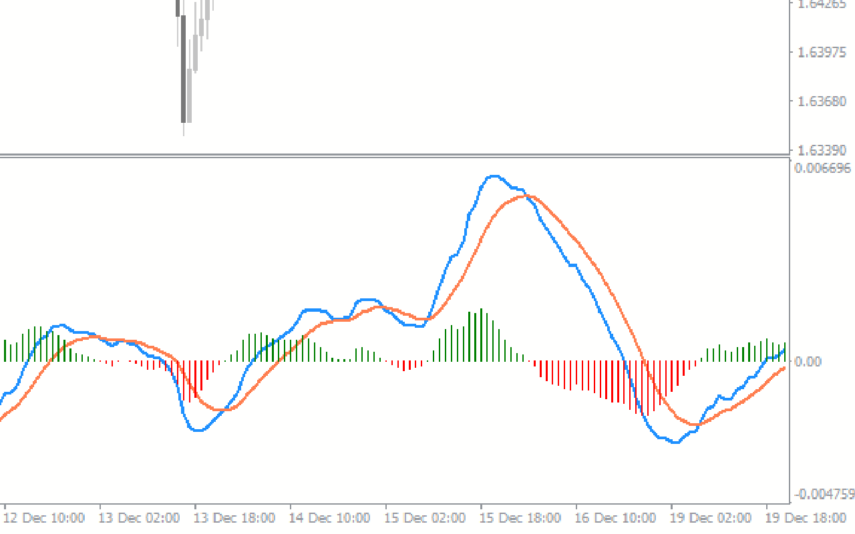
The indicator draws a range of red and blue histogram bars at the bottom of the chart. The blue bars show a bullish trend, while the red bars show a bearish trend. Moreover, the indicator can be used by new and experienced traders on any timeframe.
How the Indicator Can Benefit You
The Sentiment Histogram indicator can give great buy and sell signals and show the strength of the current trend. Traders can use it to spot reversals by waiting for the color of the bars to change. For instance, to enter a buy position, wait for the histogram to start drawing blue bars, indicating a bullish trend. Enter your buy order with your stops below the previous low and appropriate targets.
On the other hand, for sell positions, wait for the histogram to draw red bars indicating a bearish trend. Place your sell order with your stops above the previous high and appropriate targets.
Additionally, the sentiment histogram indicator can be used to anticipate reversals in the market when there is a divergence. When the trend is up with the price making higher highs while the histogram bars are making lower highs, exit your buy positions as the trend might soon reverse. On the other hand, in a downtrend, when the price is making lower lows while the indicator is making higher lows, exit your sell positions because the trend might soon reverse.
Indicator Setting Description

Period of calculation: This shows the period for the indicator calculation.
Mode of calculation: This input allows you to choose among three modes: Slow, Fast, and Balanced.
The number of bars to display: This input displays the current bar.

Reviews
There are no reviews yet.