Support and resistance levels are the key factors that determine the price movement from one zone to another. They are levels for trend reversal/breakout signals forex traders look out for before making a trade decision.
However, they are not visible on the MT4 chart. Besides, some forex traders still struggle to identify support/resistance levels on the chart, which suggests that the Support and Resistance Indicator would be indispensable in day-to-day trading activities, especially for beginners.
What indicator shows support and resistance on MT4?
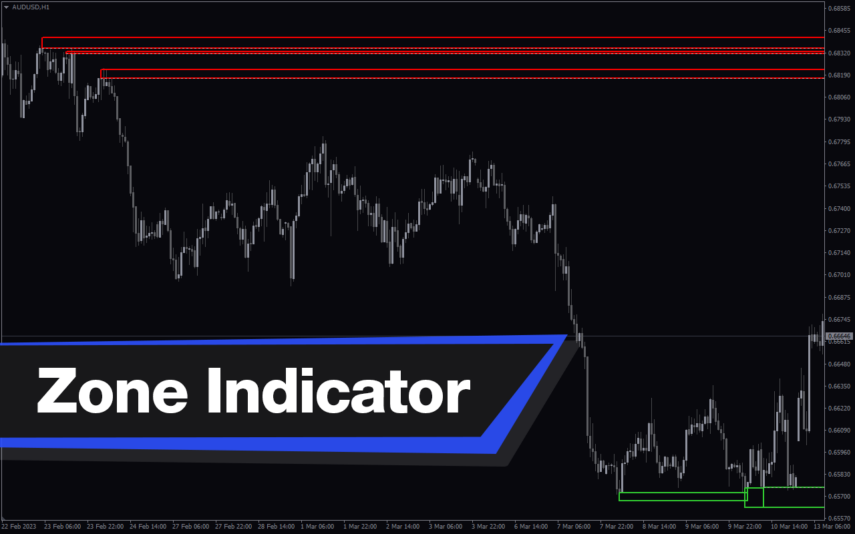
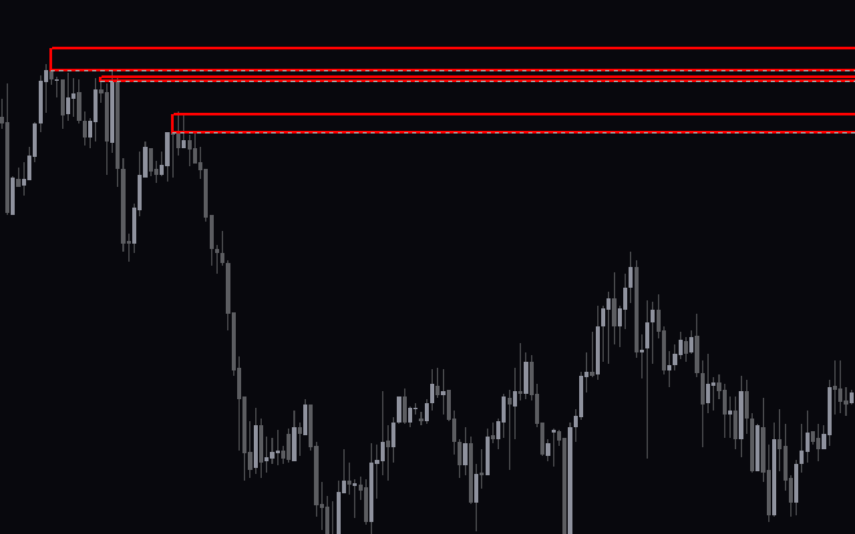
The Support and Resistance Indicator is a custom trading tool for MT4 developed to plot support/resistance zones from past price actions. It identifies both major and minor support/resistance levels on the MT4 chart.
Features of the Support and Resistance Indicator
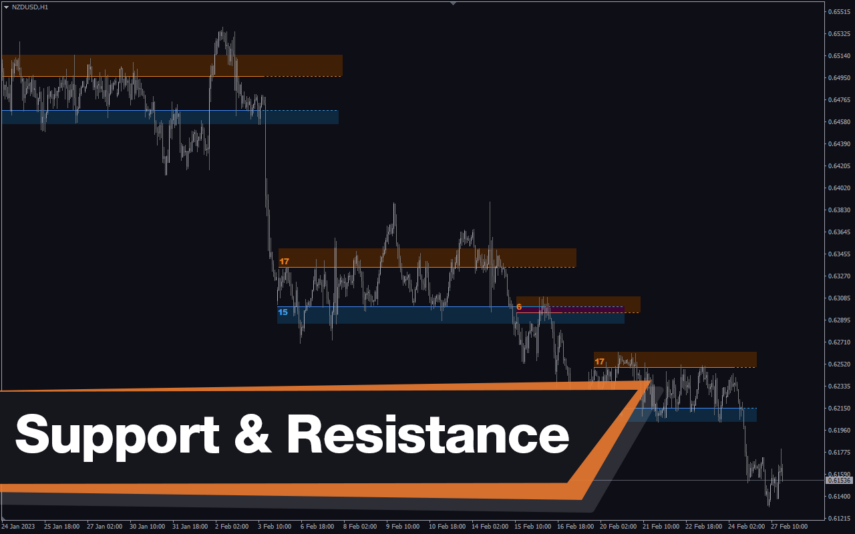
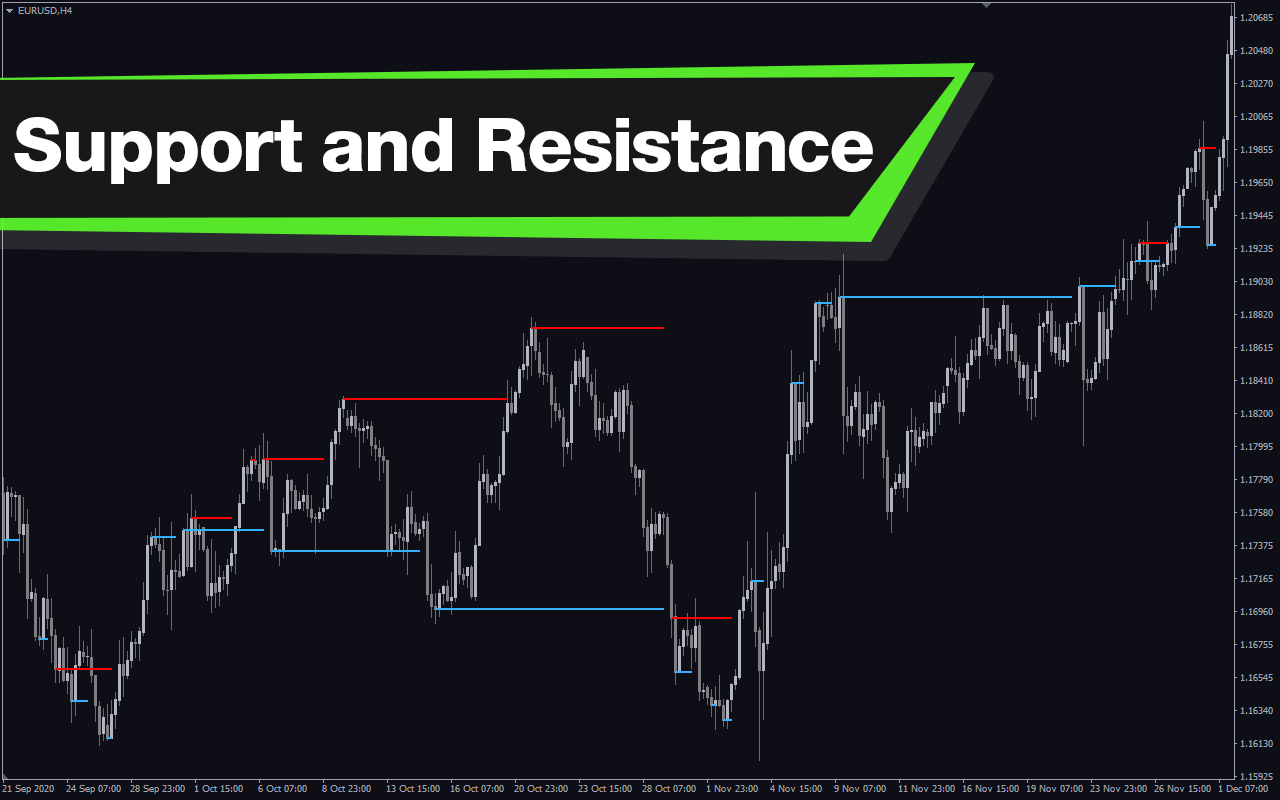
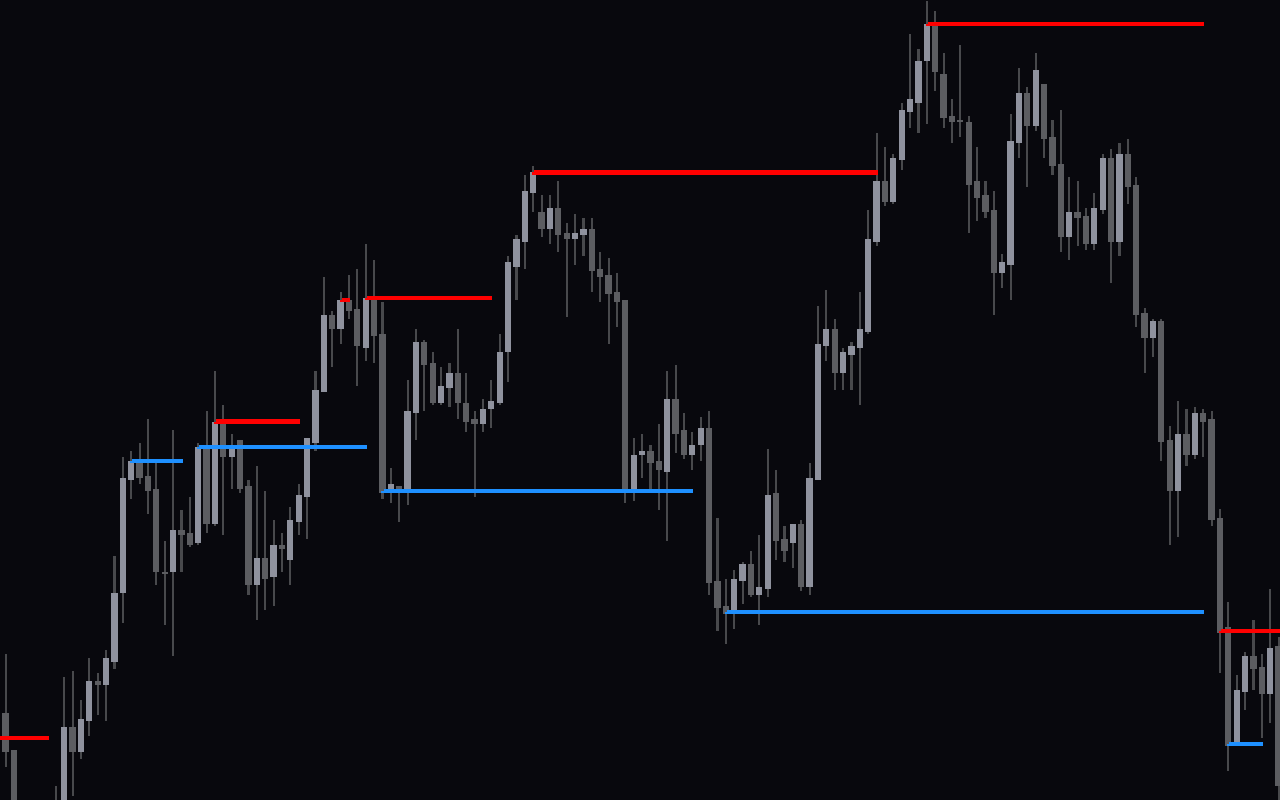
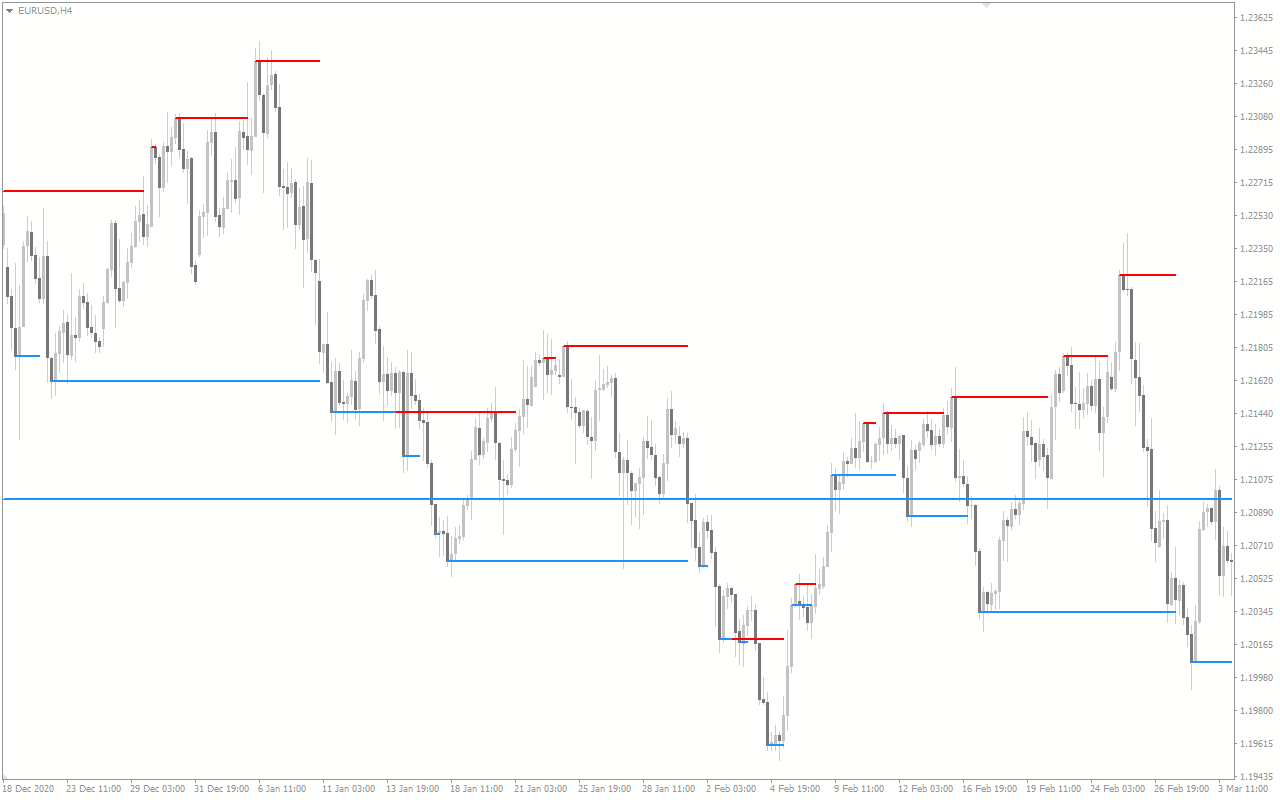
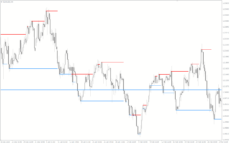
The indicator is enabled to display support/resistance zones on different timeframes. Support levels are in red lines, while resistance zones are in dodger blue lines. In addition, the support/resistance lines are identified and drawn from the H4, D1, and W1 timeframes.
Benefits of Using the Indicator
- Ease technical analysis: The indicator makes technical analysis less hassle by displaying valid support and resistance zones. A trader can analyze the market to anticipate levels for potential price bounce/breakouts.
- Saves Time: The indicator takes care of the stress of manually searching for support/resistance zones, thereby saving time.
- Better Entry/Exit Point Assessment: The indicator also helps a trader evaluate optimal zones to place a BUY/SELL order or to exit a trade. In other words, it assists traders to be wary of opening a trade position around a support/resistance area.
- Trend Reversal/Continuation: Finally, the indicator easily identifies zones where the price may bounce and change direction or continue after a breakout.
Indicator Description Settings
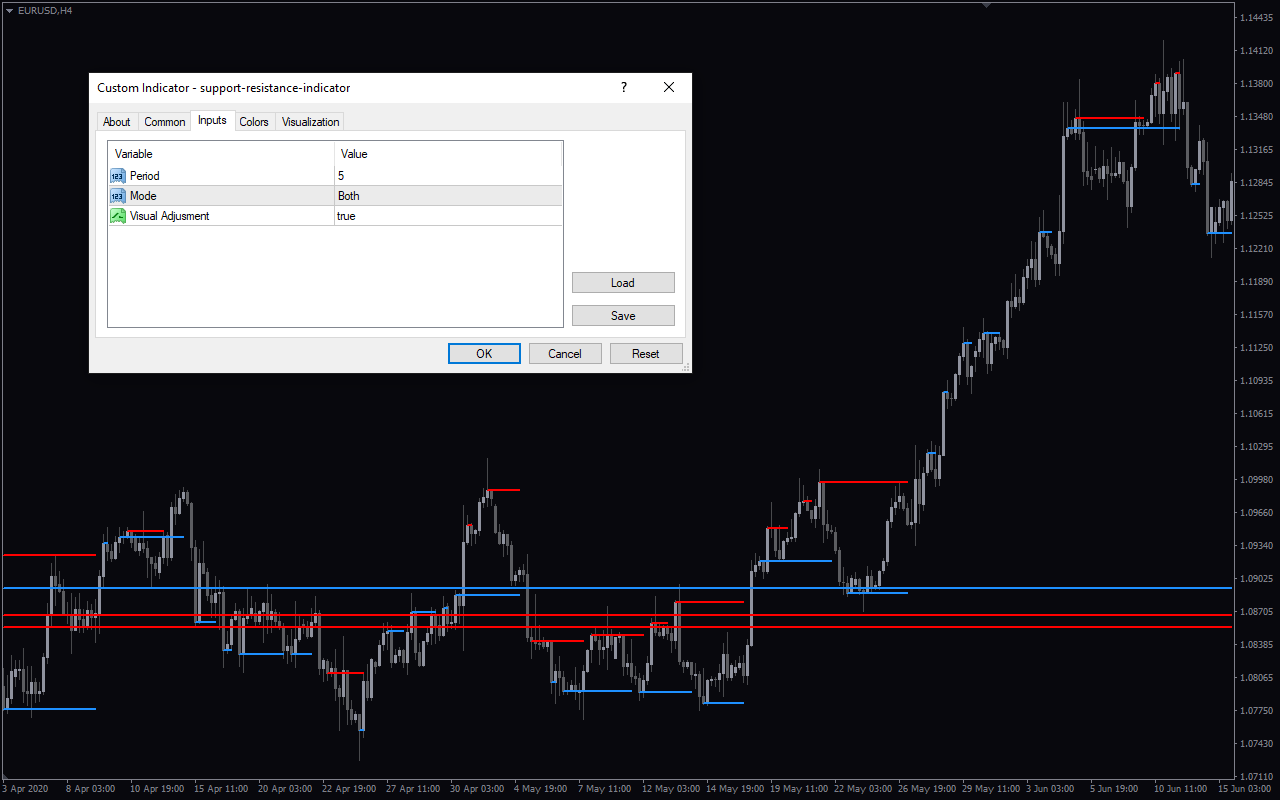
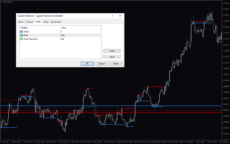
The indicator comes with the following customizable settings:
Period: This determines the period of the indicator.
Mode: This shows the mode to plot the support/resistance levels.
Visual adjustment: Enables/Disables the sensitivity adjustment mode.

PlatinumTrader-Collection –
Good!