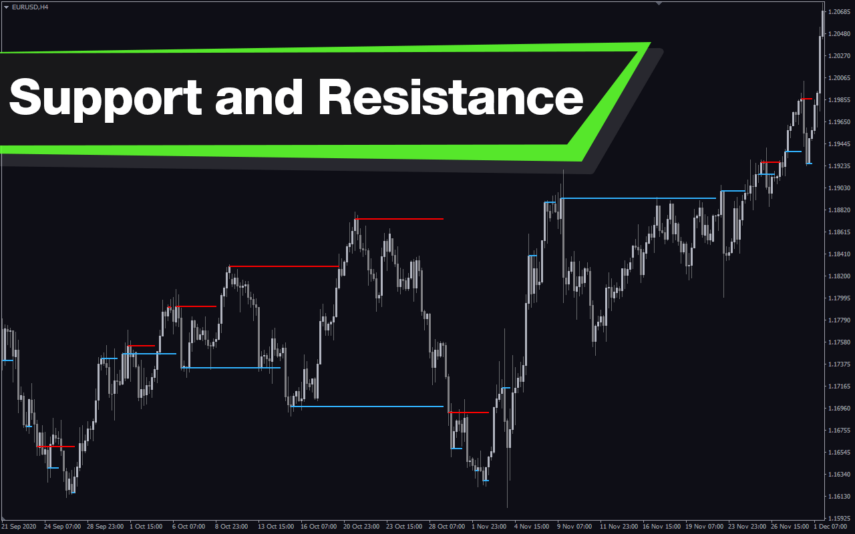
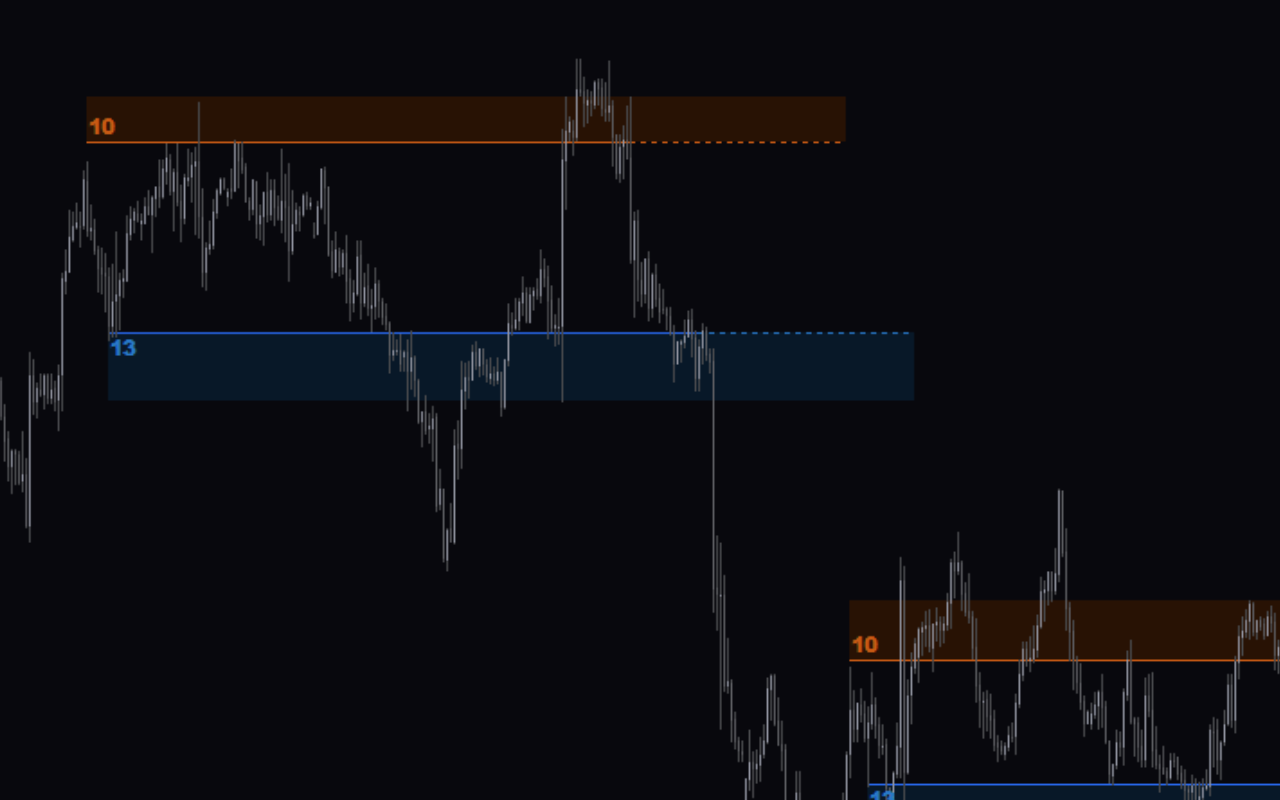
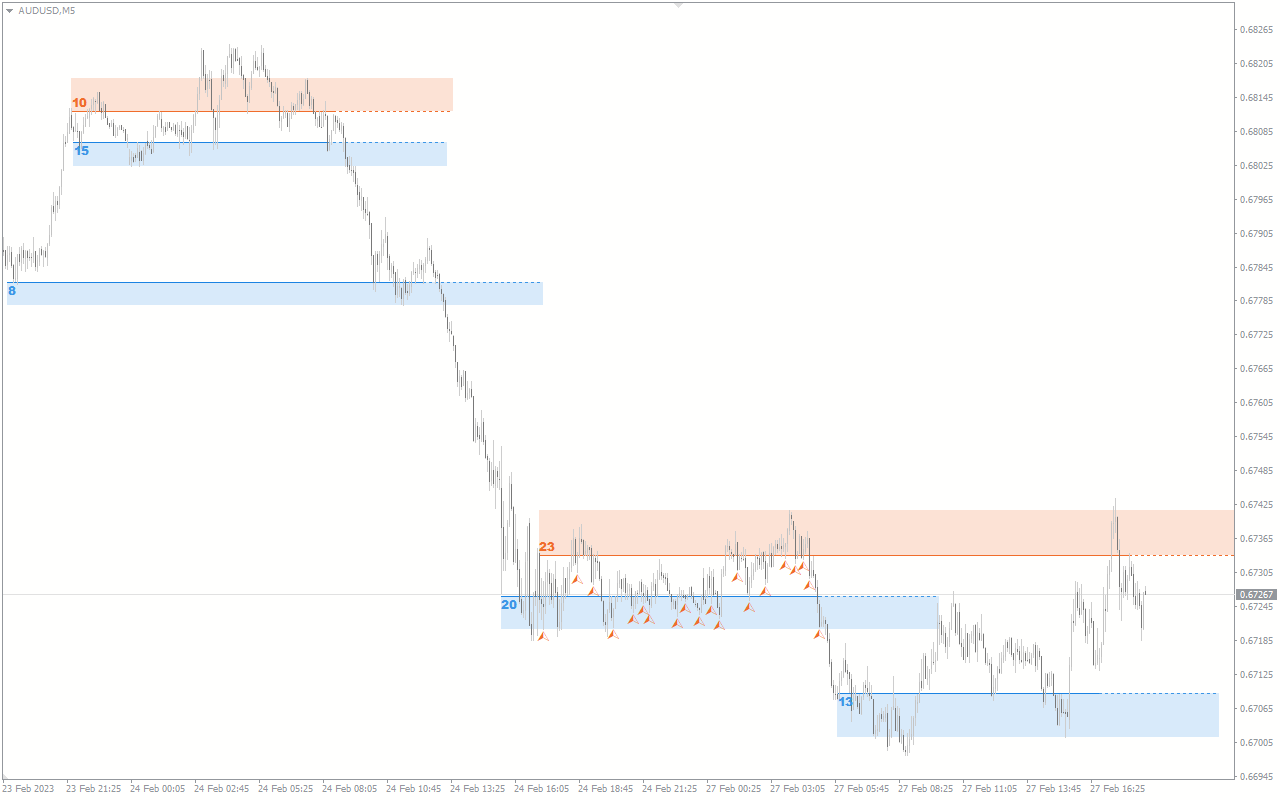
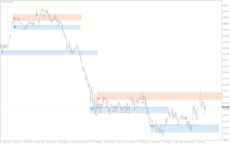
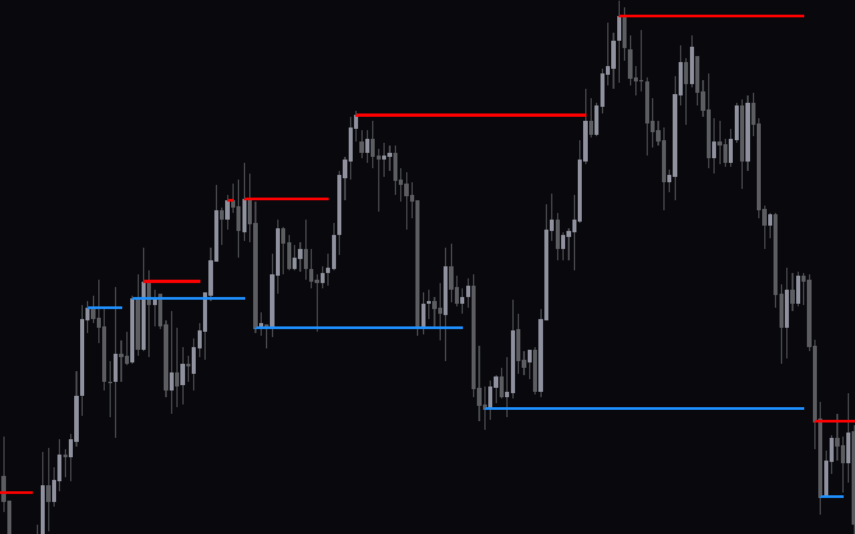
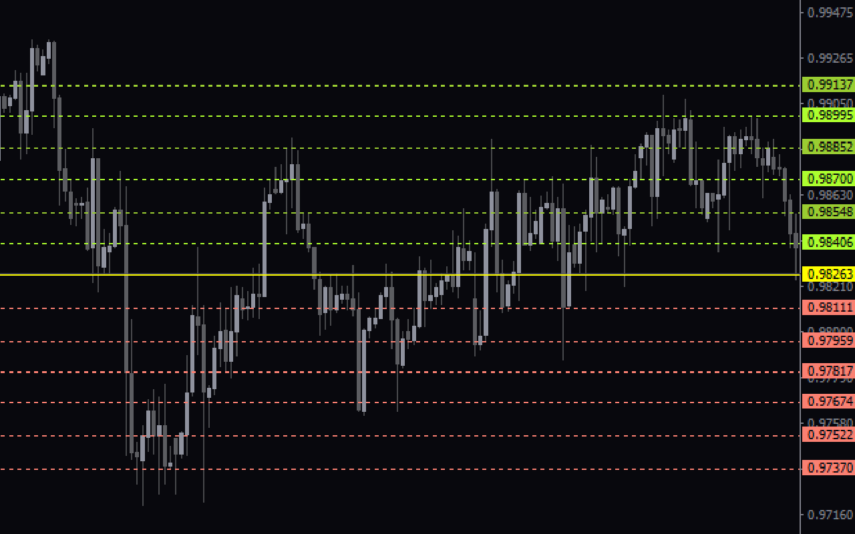
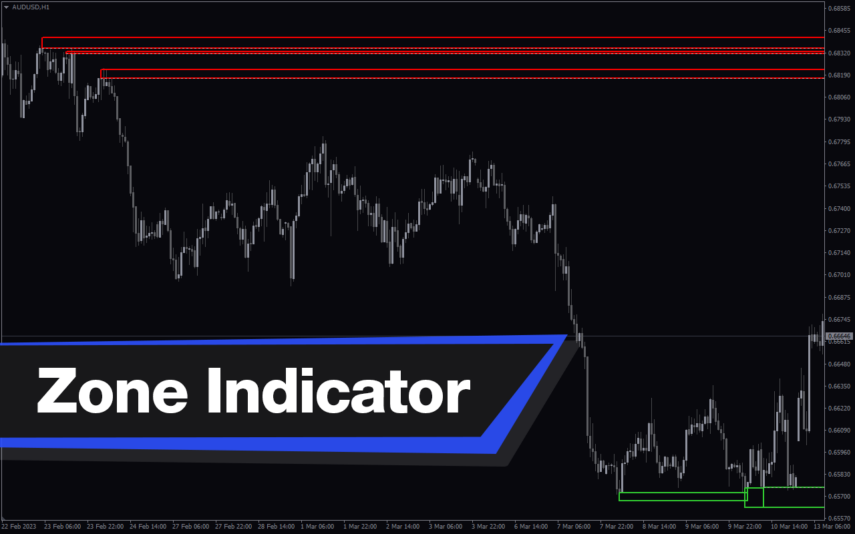
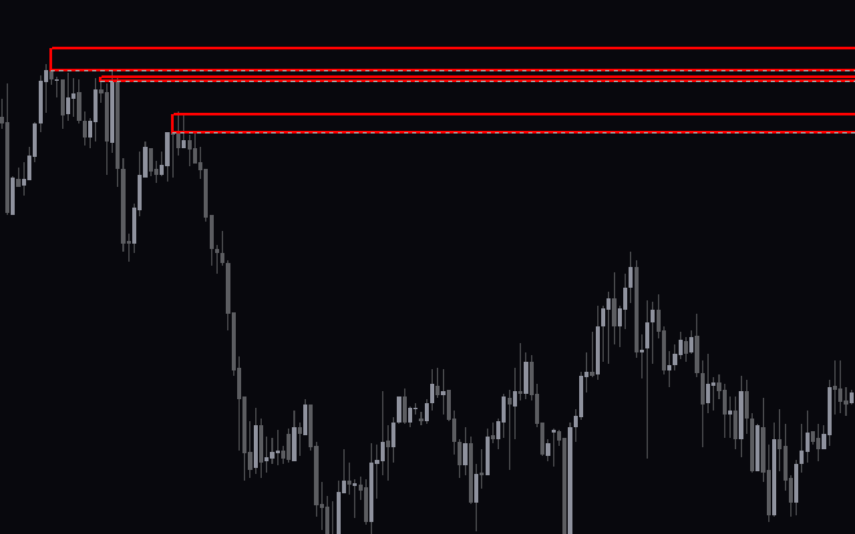
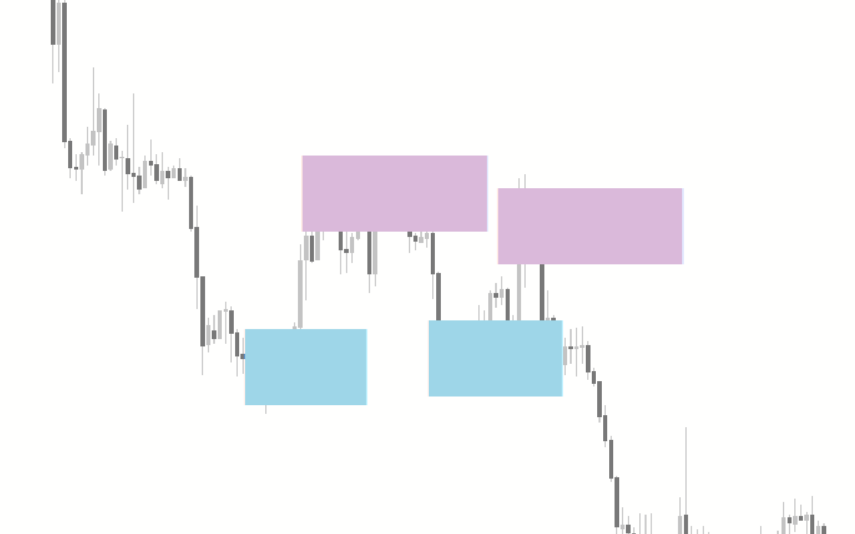
The Support & Resistance indicator is an indicator that identifies trend reversal/continuation zones on the MetaTrader 4 (MT4) platform. It identifies the major support and resistance zones in the financial market, where the price is bound to reverse upon retest or break out for a continuation.
What is the best indicator for Support & Resistance?
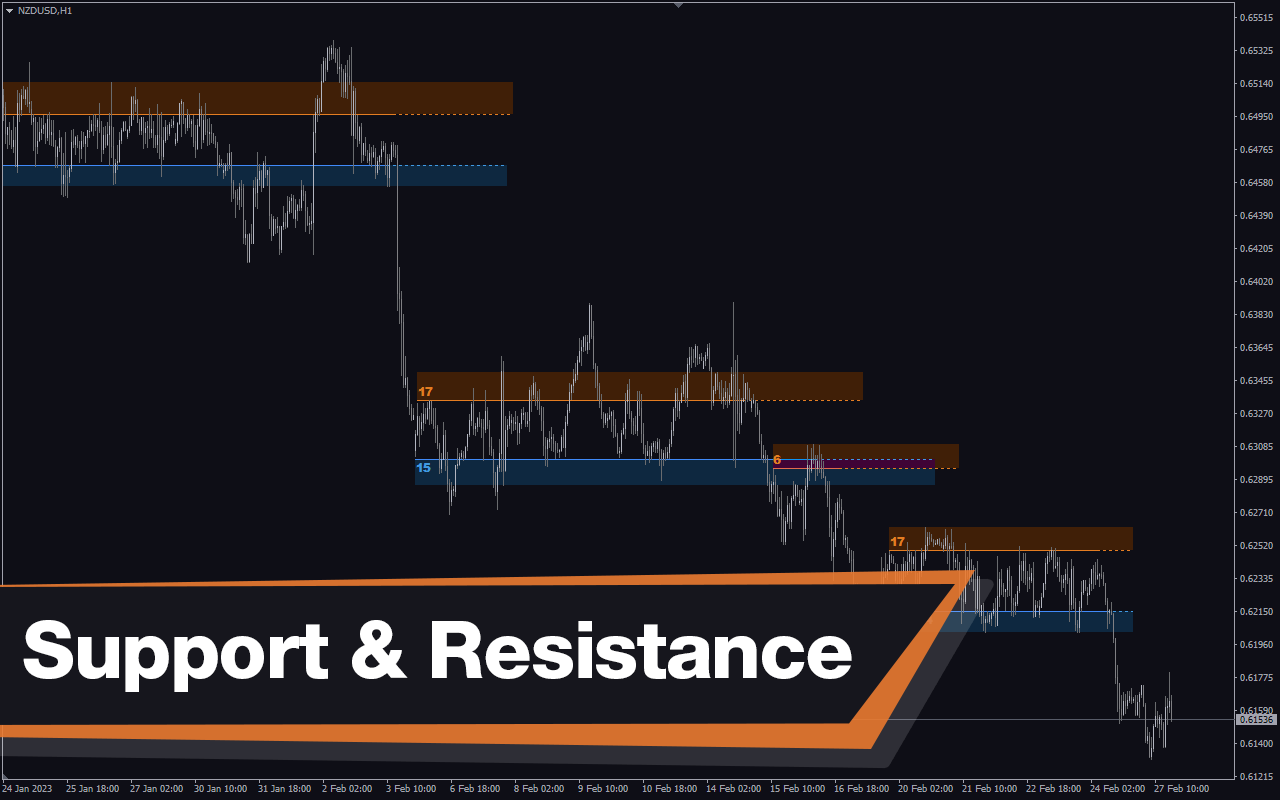
One of the best indicators that accurately detects the support/resistance zone is the Support & Resistance indicator for MT4. It identifies major levels and marks them as zones, which is more reliable than plotting horizontal lines.
Besides, it also comes with a feature that highlights the number of times the price has reacted to a support/resistance zone. The feature helps traders anticipate the possibility of a support/resistance zone to hold the price or be broken.
Features of the Support & Resistance Indicator
The Support & Resistance supports customization of the inbuilt parameter to a trader’s preference. It also makes projections of the future support/resistance level.
Finally, the indicator keeps a tab on the number of times a support/resistance zone has been tested by the price.
Benefits of Using the Indicator
- Identifies Key Level: The indicator is optimized to detect key price levels for potential reversal/breakouts.
- Risk Management: The indicator is also a handy tool for managing trades. For instance, a trader may close a running BUY position when the price approaches a major resistance zone.
- Trend Reversal/Continuation: The Support & Resistance indicator helps a forex trader highlight zones to anticipate a possible trend reversal or continuation after a breakout.
Indicator Description Settings
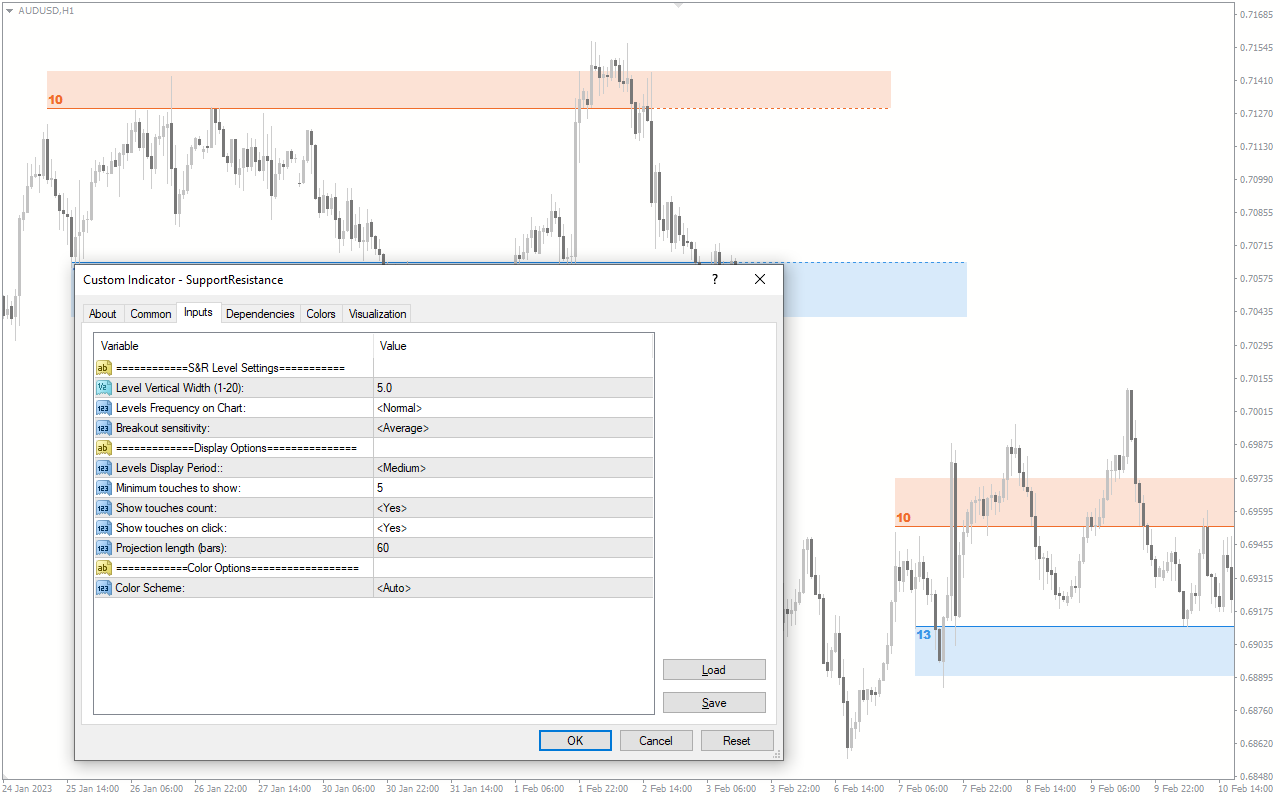
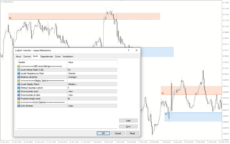
The indicator comes with the following customizable settings:
Level vertical Width (1-20): Determines the width of the support/resistance levels.
Levels Frequency on Chart: Determines the frequency at which a support/resistance zone is displayed.
Breakout Sensitivity: Determines the breakout sensitivity (high, low, or medium) level.
Levels Display Period: Determines the types of levels (medium, short, or long) to be displayed.
Minimum touches to show: Determines the minimum touches to show.
Show touches count: Enables/Disables the indicator to display the number of times a support/resistance level has been touched by the price.
Shows touches on click: Enables/Disables touches on click.
Projection length: Enables/Disable extension of future support/resistance zones.
Color Scheme: Enables/Disables automatic detection of suitable colors for the support/resistance zones.

PlatinumTrader-Collection –
СOOLL!!