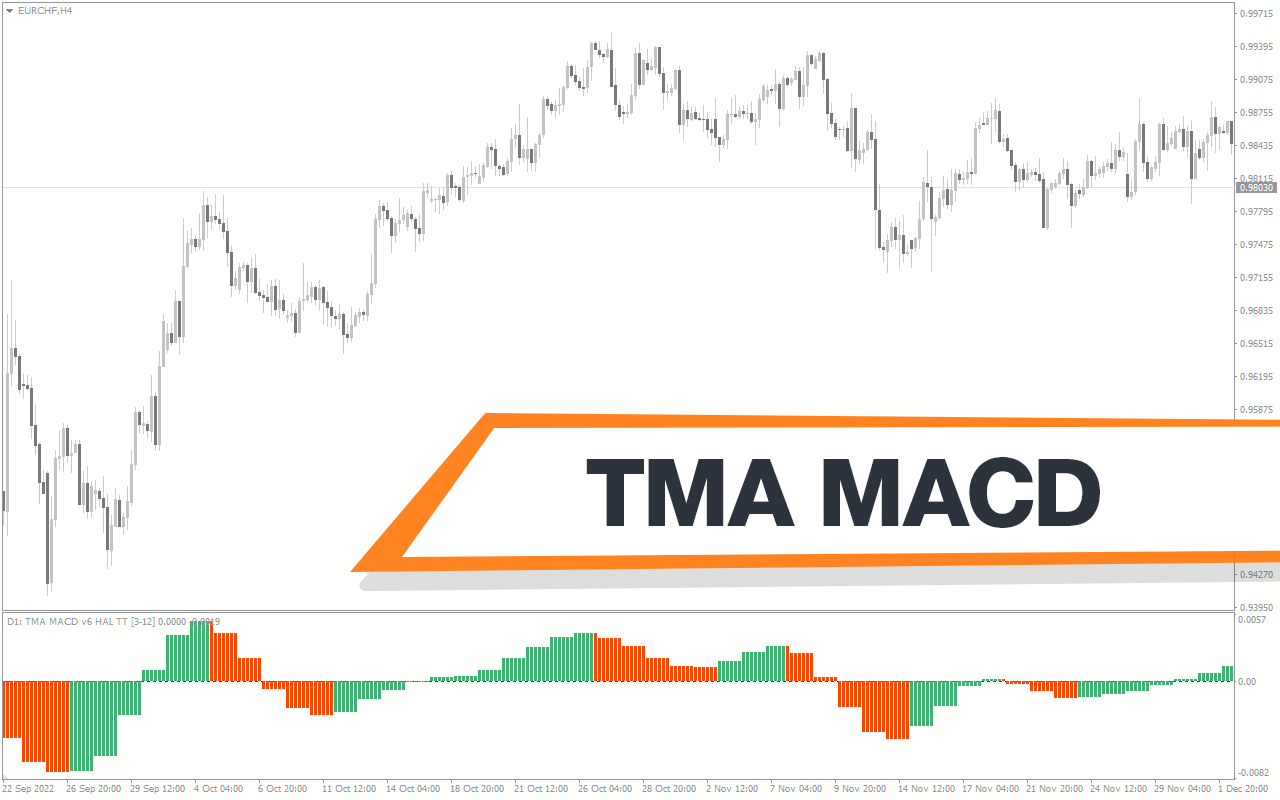
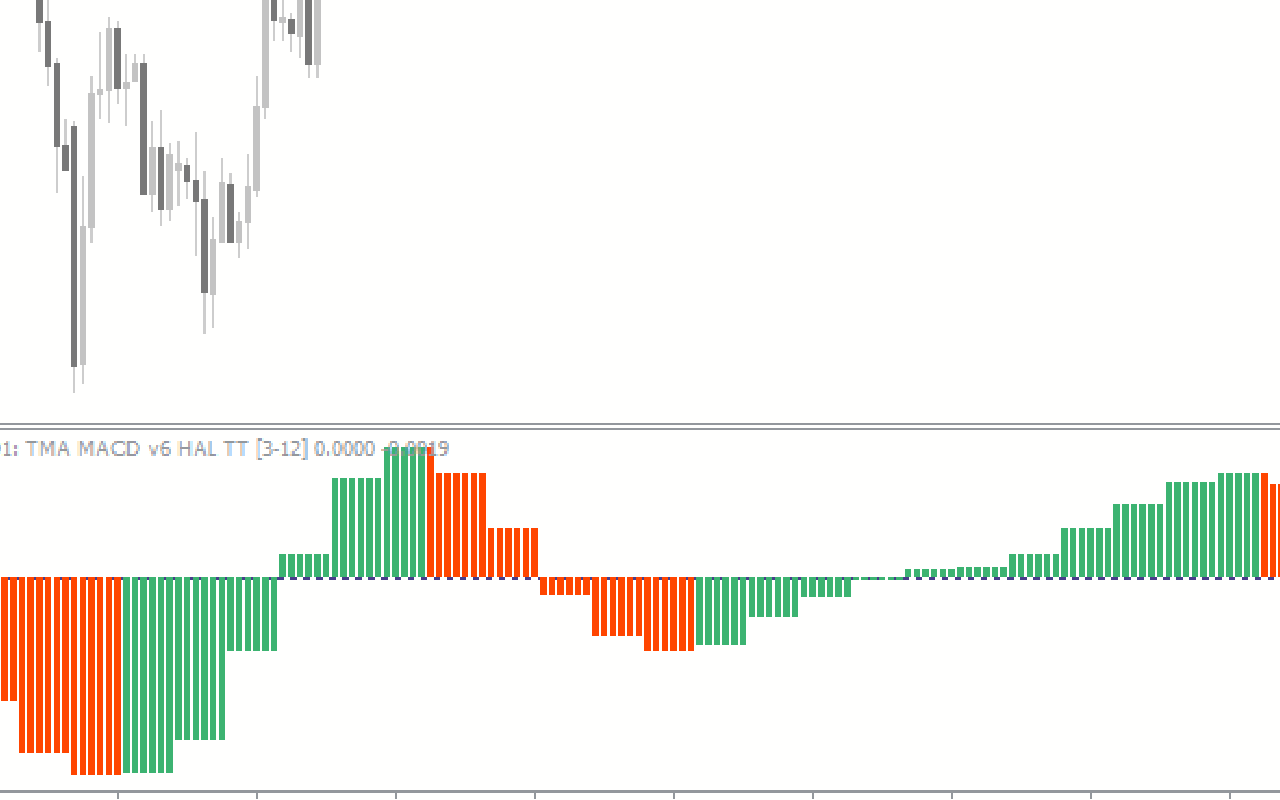
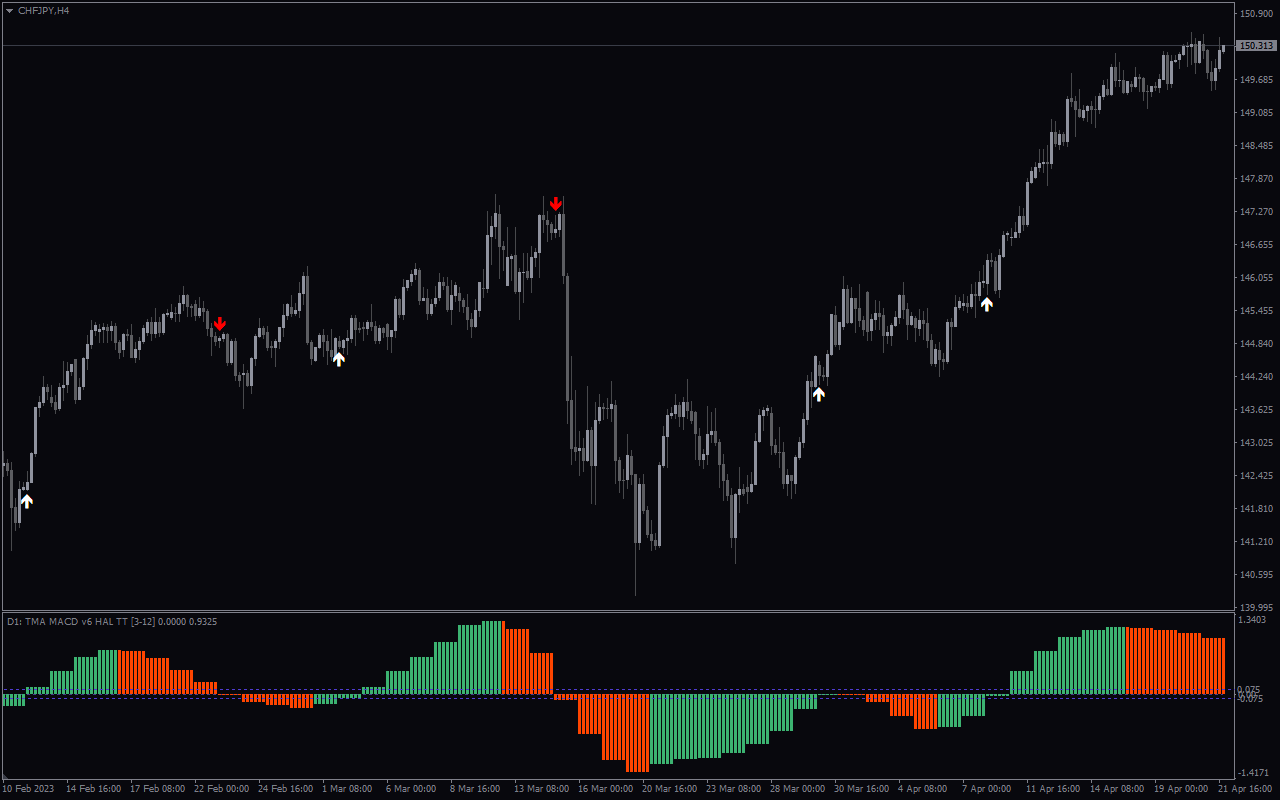
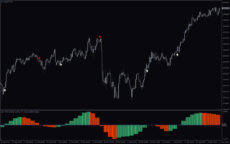
The Triangle Moving Average, otherwise known as TMA, is a technical analysis tool that delivers a visual representation of the trend direction of an instrument. It depicts a bullish/bearish market condition when the TMA line and the MACD cross above/below a designated zone known as the hot level.
The indicator is reliable and suited for different trading approaches (scalping, day, and swing) because it defines the trend direction and identifies the reversal zone using a synergy of TMA and the MACD.
Features of the Indicator
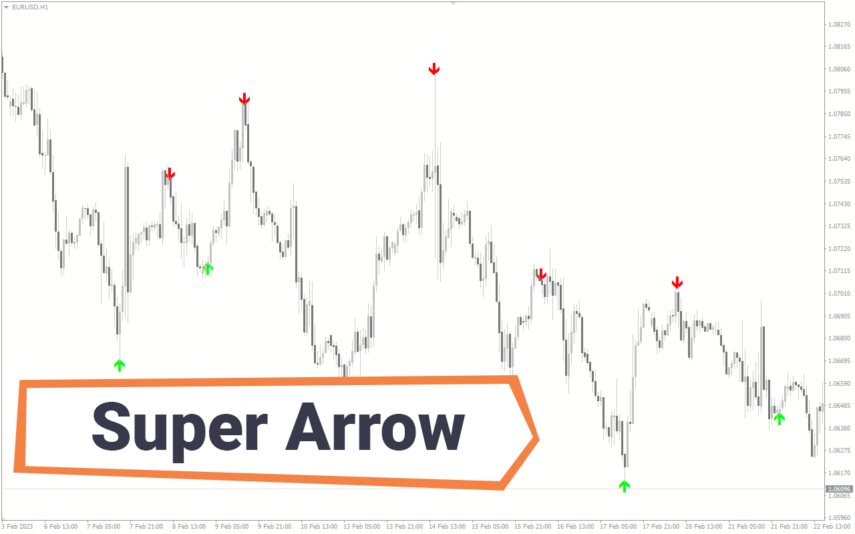
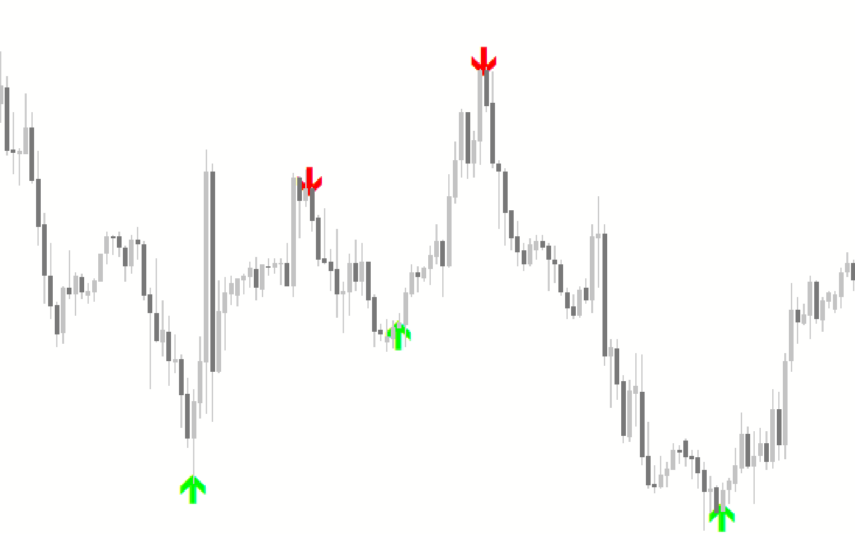
The TMA line of the indicator is less susceptible to lagging behind the price. In addition, the indicator works in synergy with the data of the MACD; it generates a buy/sell signal whenever the MACD and the TMA line cross over.
Moreover, the indicator’s signals are easy-to-understand – buy/sell when the histogram bar is above/below the hot level. Thus, it is ideal for beginners/intermediate and advanced forex traders.
Furthermore, the indicator allows the customization of the inbuilt parameters to suit users’ trading styles. What’s more, the ‘timeframe auto’ Parameter of the indicator enables it to refer to the next higher timeframe for analysis, thereby filtering out false signals.
Benefits of the Indicator
a) Accurate signals: The indicator delivers a more accurate trend analysis because signals are displayed only when the TMA and the MACD are in sync.
b) Reliable trend analyzer: The indicator uses a confluence of two indicators to display the true direction of the market, making it a suitable tool for technical analysis.
c) Trend reversal: The indicator makes it pretty easy to identify a trend reversal setup at a glance.
d) Signal alert: The TMA indicator also delivers trade signals to the emails or mobile phones of users. This helps forex traders to keep a tab on the signals even while off the chart. In essence, it reduces screen time.
Indicator Settings Description
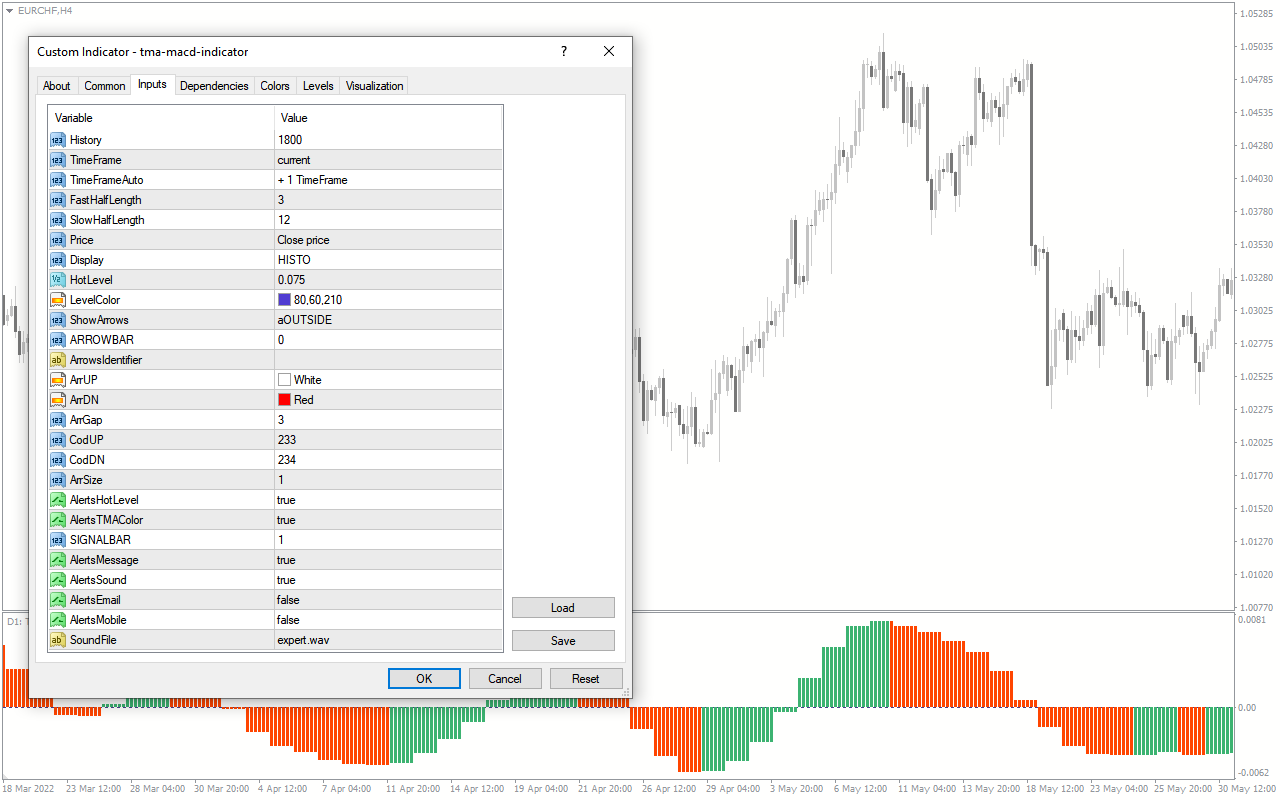
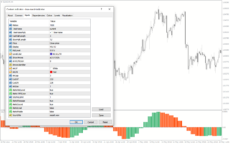
The indicator comes with the following customizable settings:
History: This defines the lookback period for trend analysis.
Timeframe: This shows the timeframe for analysis.
Timeframe Auto: This enables/disables the indicator to use the chart of the higher timeframe for analysis.
Fast Half Length: This shows the TMA value for analysis.
Slow Half Length: This shows the TMA value for analysis.
Price: This shows the price value for analysis.
Display: This determines how the MACD would be displayed.
Hot level: This level defines the market into bullish and bearish trends.
Level color: This shows the color of the MACD line.
ShowArrow: This determines where the signal would be displayed on the chart.
ArrowBar: This enables/disables the indicator to display the arrow signal bar.
ArrUp: This shows the color for the sell signal arrow.
ArrDN: This shows the color for the buy signal arrow.
arrGap: This defines the gap between the signal arrow and the candlestick.
CodUp: This determines the arrow style for a bullish signal.
CodDN: This determines the arrow style for a bearish signal.
Arrsize: This defines the size of the signal arrow.
AlertHotLevel: This enables/disables a signal alert at the hot level.
AlertsTMAColor: This enables/disables the alerts TMA color
SignalBar: This shows the signal bar.
Alertsmessage: This enables/disables the indicator to send signal message alerts.
Alertssound: This enables/disables the signal alert sound.
Alertemail: This enables/disables signal alerts via emails.
Alertmobile: This enables/disables signal alert mobile phones.

Reviews
There are no reviews yet.