Features of the Trend Several Time Frames Indicator
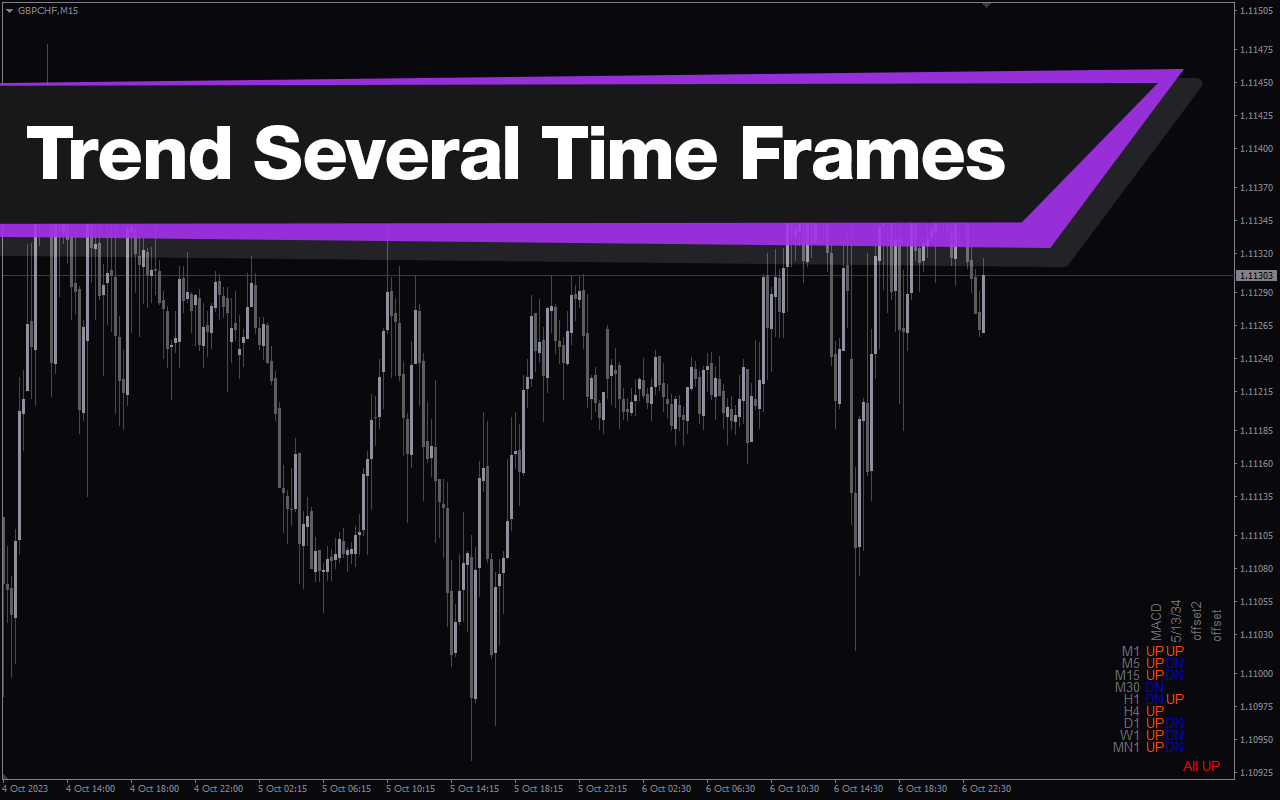
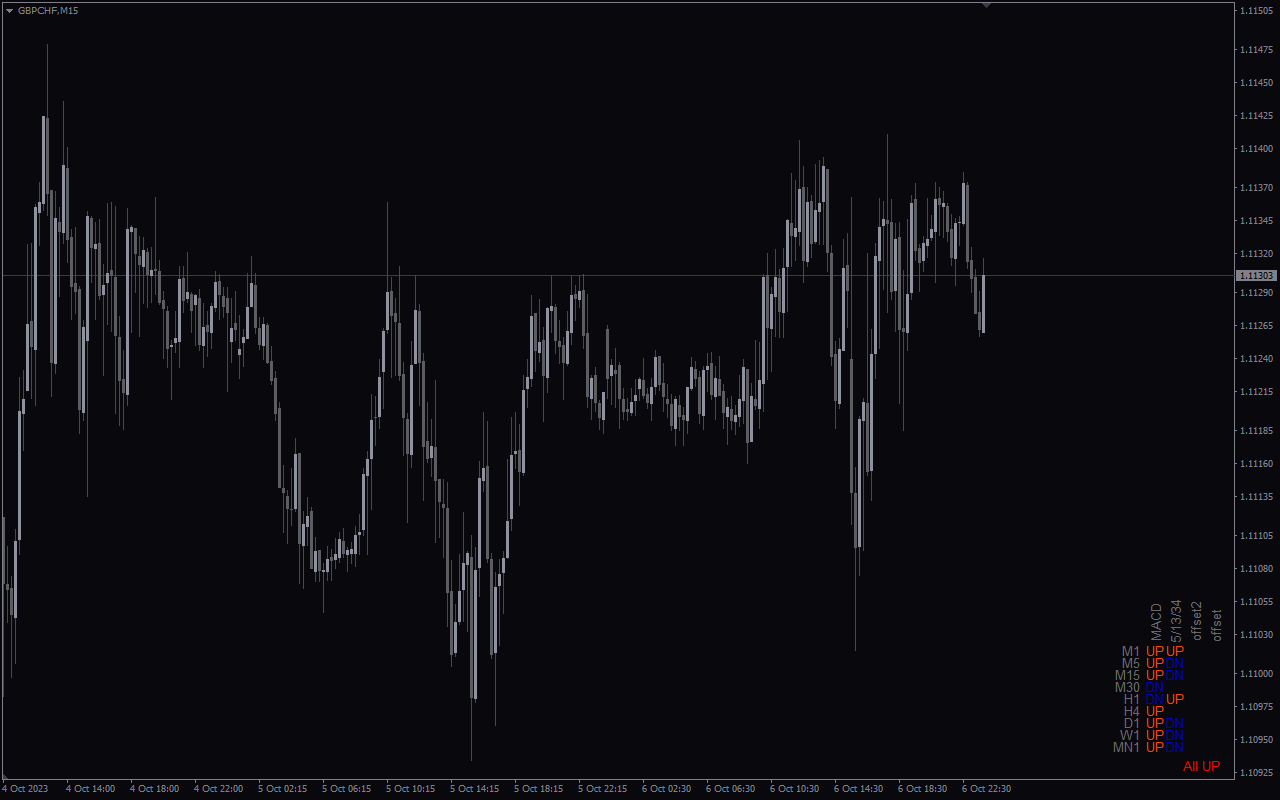
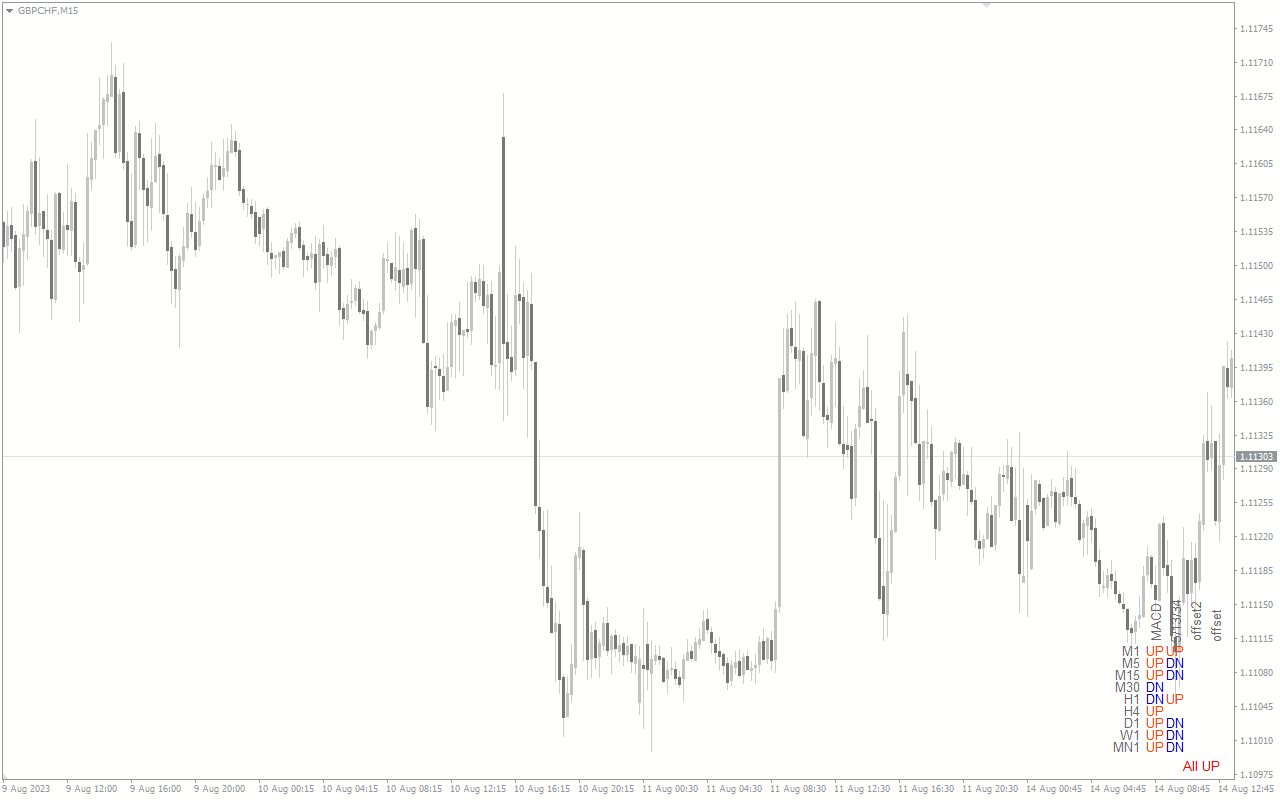
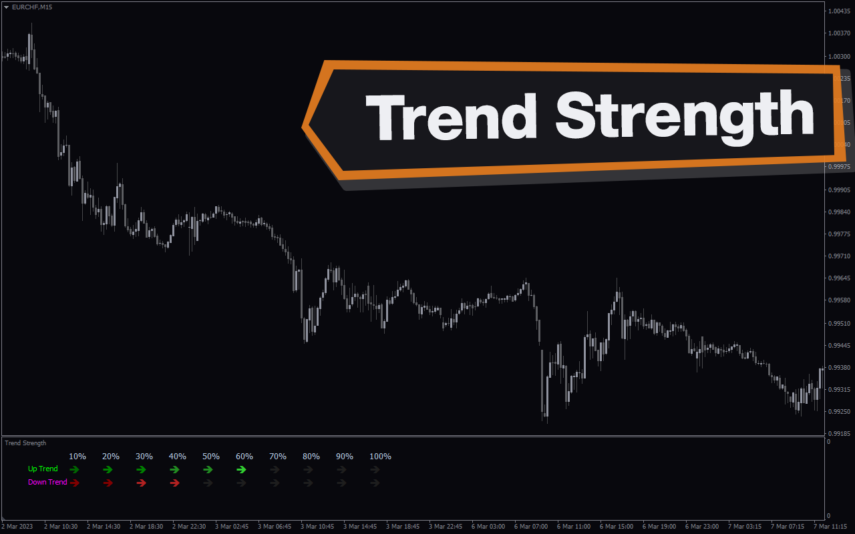
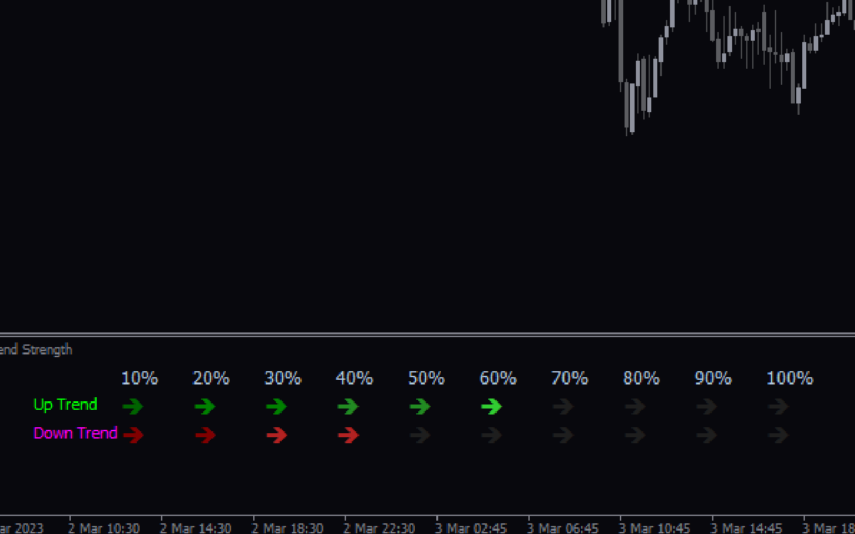
This Trend Several Time Frames Indicator uses the Moving Average Convergence Divergence (MACD) indicator to show the nature of trends on various timeframes. This indicator draws a table in the bottom right corner of the price chart. The table has timeframes starting from the M1 to the W1. Furthermore, a MACD section indicates whether the trend on a specific timeframe is up or down. The texts under the MACD section are color-coded. The ups are in blue, while the downs are in red. At the bottom of the table, the indicator shows the average trend.
How the Indicator Can Benefit You
The indicator does not give clear entry signals. You can, however, use the information to analyze the markets. When placing trades, traders should have information on the trend on higher timeframes. Your chances of entering successful trades increase when you align with the trends of higher timeframes.
Indicator Setting Description
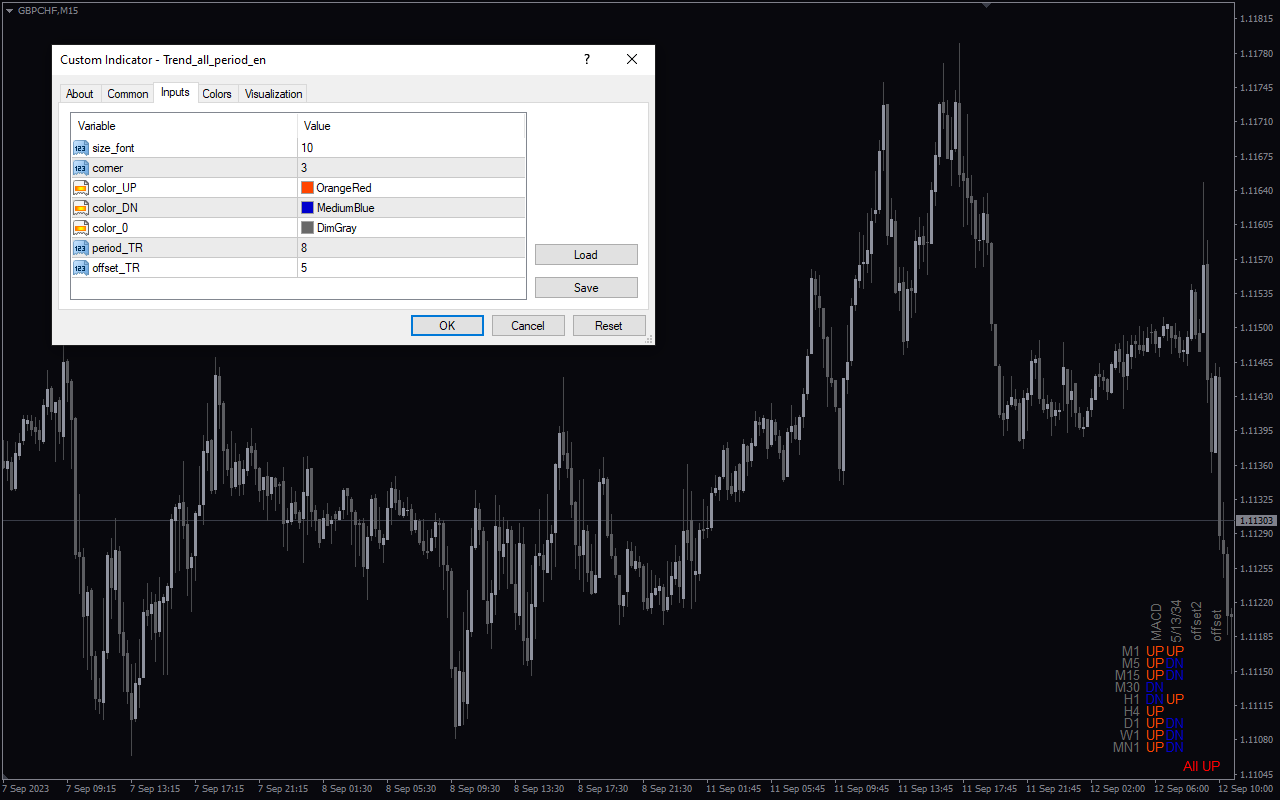
Size font: The default value is 10. This input allows you to change the font size of the text in the indicator.
Corner: The default value is 3. This input allows you to change the value of the corner.
Color_UP: This input allows you to choose the color of the color UP section of the indicator. The default color is orange.
Color_DN: This input allows you to choose the color of the color DN section of the indicator. The default color is blue.
Color_0: This input allows you to choose the color of the color 0 section of the indicator. The default color is grey.
Period_TR: This input allows you to change the indicator period.
Period_TR: This input allows you to change the indicator period.





Reviews
There are no reviews yet.