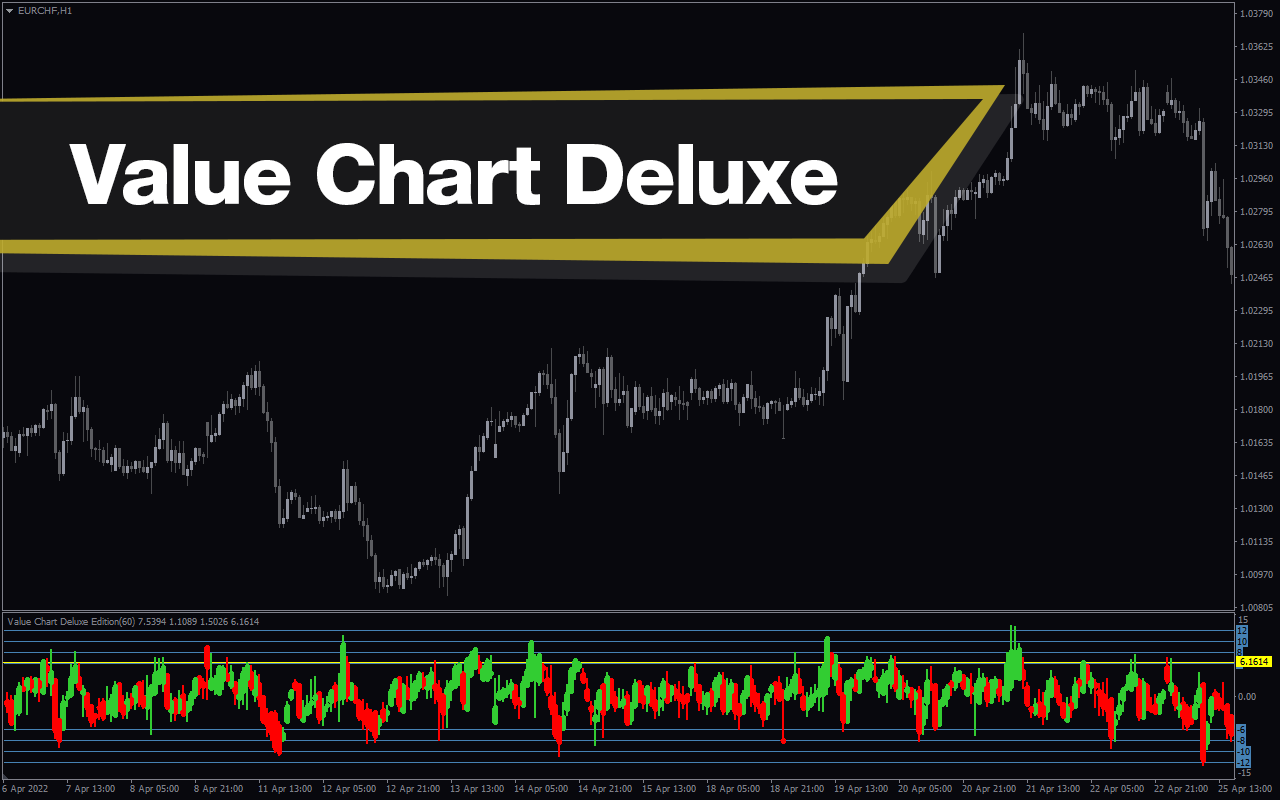
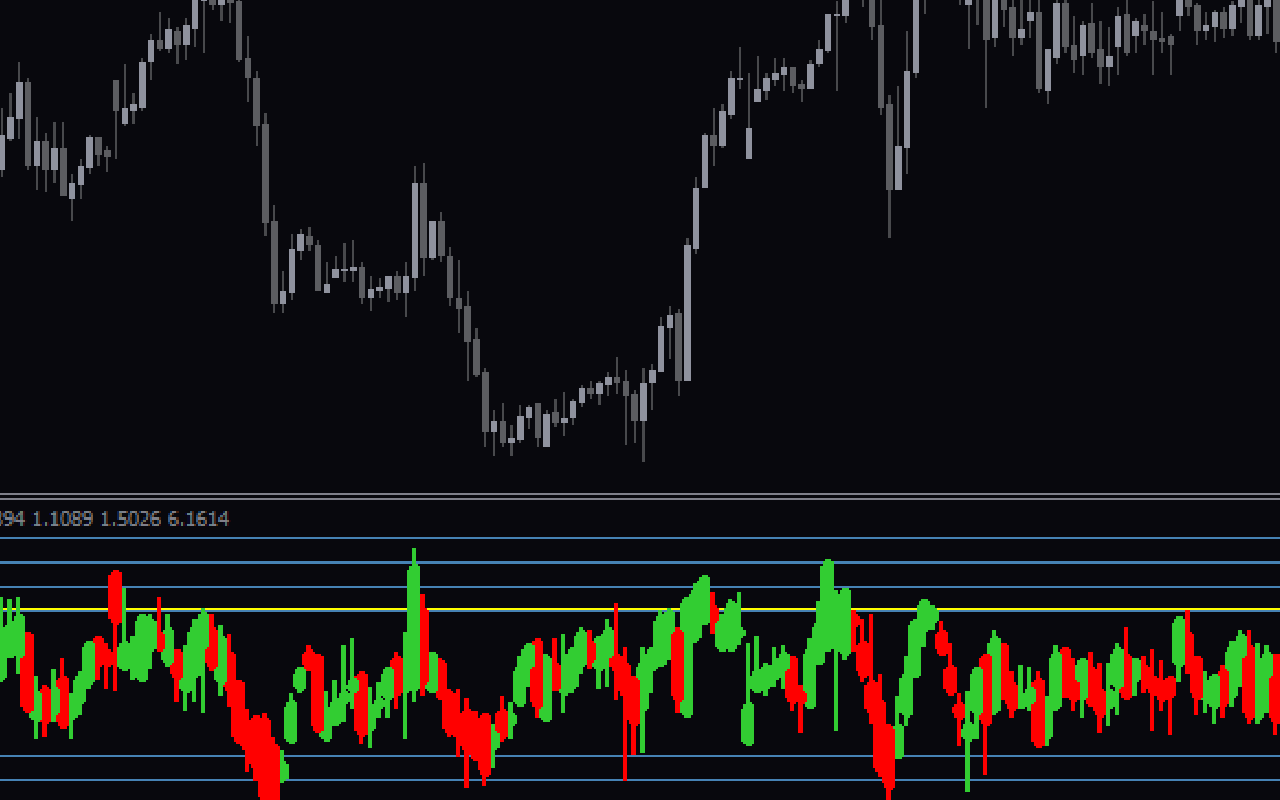
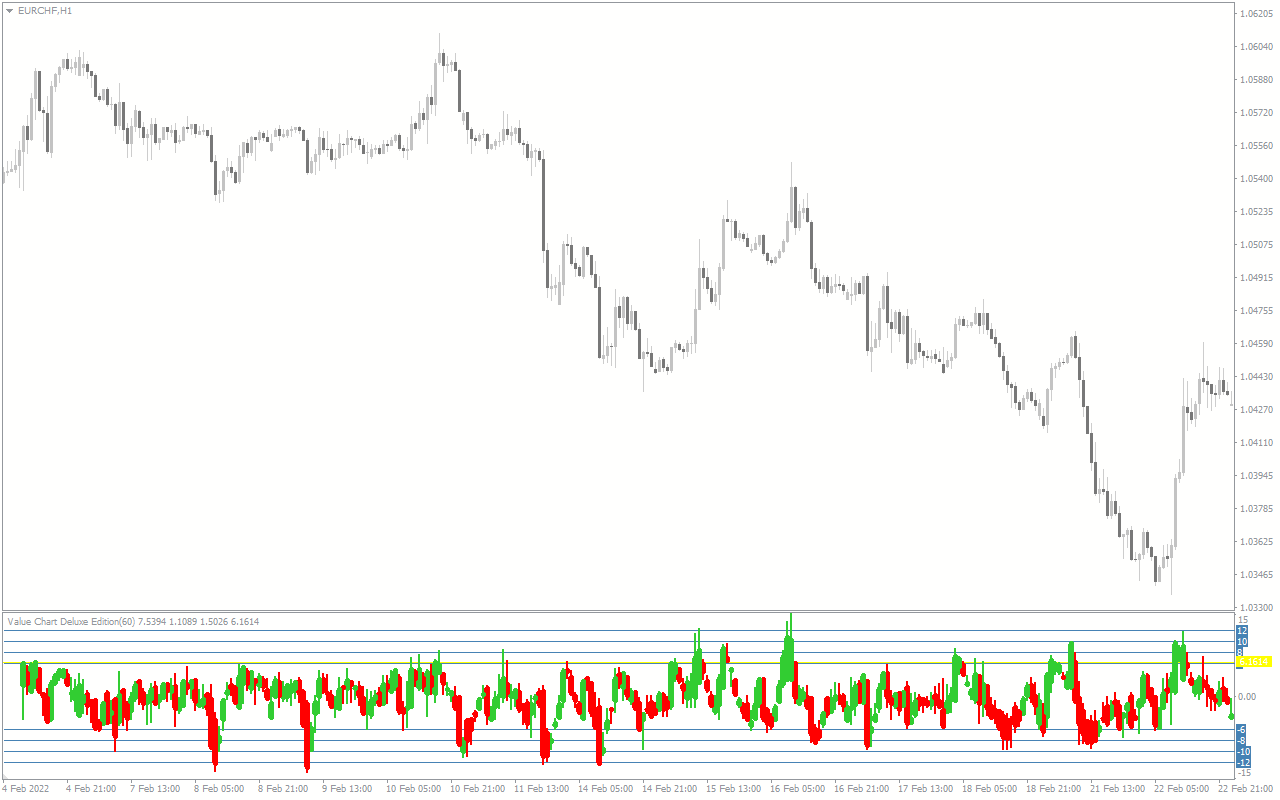
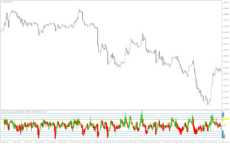
The Value Chart Deluxe Indicator is a best free Forex indicator specifically designed for the MT4 platform. This powerful tool assists traders in identifying potential trading opportunities and making well-informed decisions when entering or exiting the market. The Value Chart Deluxe Indicator utilizes a unique algorithm that provides traders with a clear, visual representation of price movements. By plotting the current price level of a currency pair as a point on a chart and calculating the average of the last ten price points as a line, traders can easily assess the trend direction and strength.
Features of the Indicator
The Value Chart Deluxe Indicator offers several notable features that make it a valuable tool in the Forex market. Firstly, it provides a simple and intuitive visual representation of price movements. Traders can quickly identify whether the market is in an uptrend or a downtrend based on the relationship between the current price and the average line. If the current price is higher than the average, it indicates an uptrend, while a lower current price suggests a downtrend.
Furthermore, the Value Chart Deluxe Indicator helps traders gauge the strength of the trend. By assessing the distance between the current price and the average line, traders can evaluate the momentum of the market. A larger distance signifies a stronger trend, providing traders with confidence in their trading decisions.
Moreover, the indicator is highly versatile and can be used on various timeframes and currency pairs. This flexibility allows traders to incorporate the Value Chart Deluxe Indicator into their preferred trading strategy, whether it be scalping, day trading, or swing trading.
How the Indicator Can Benefit You
The Value Chart Deluxe Indicator offers numerous benefits to Forex traders. Firstly, it enhances overall technical analysis by providing a clear visual representation of price movements. This allows traders to quickly and easily identify trend directions, supporting their decision-making process.
Secondly, the indicator assists traders in identifying potential trading opportunities. By visually observing the relationship between the current price and the average line, traders can pinpoint favorable entry and exit points. For example, traders may consider entering a buy position when the current price crosses above the average line, signaling a potential uptrend.
Furthermore, the Value Chart Deluxe Indicator provides valuable insights into the strength of the trend. Traders can assess the momentum of the market, enabling them to manage positions more effectively. For instance, traders may choose to hold onto a position during a strong trend, aiming for larger profits, or consider taking profits during a weakening trend.
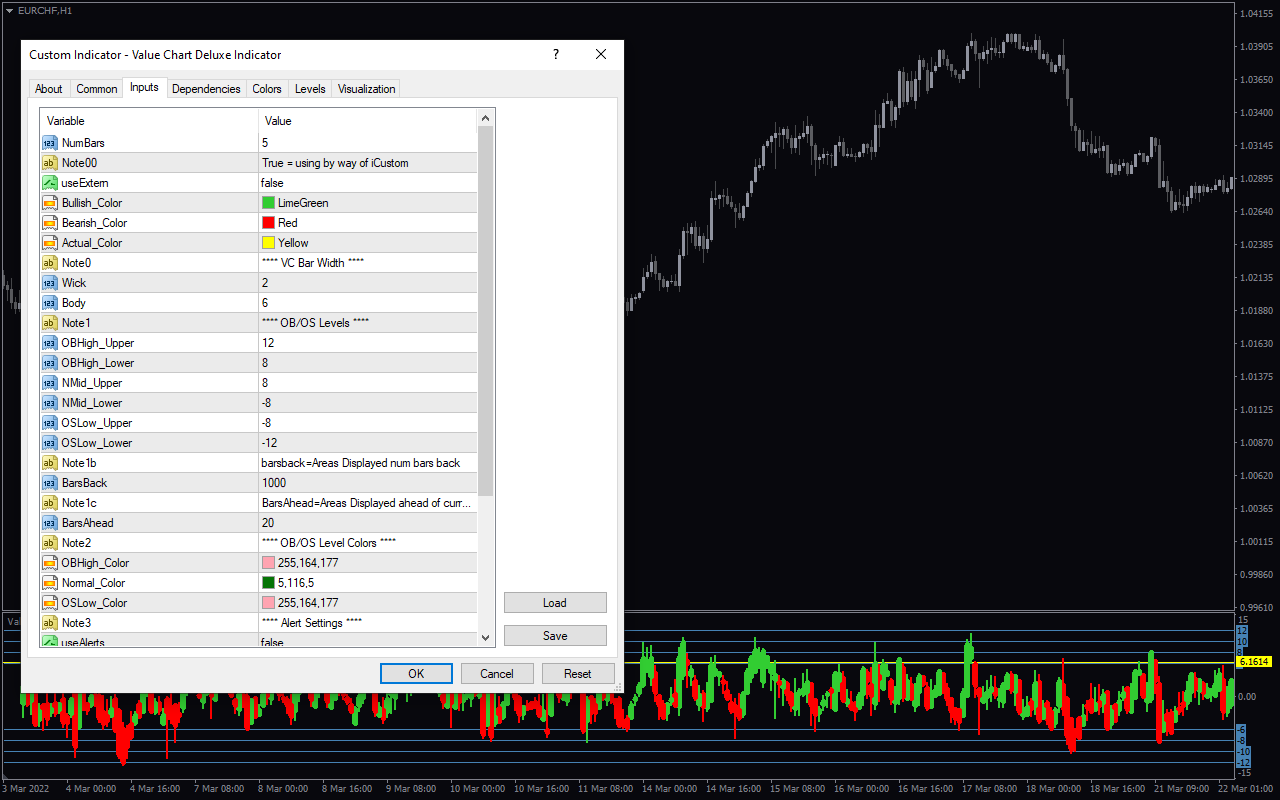
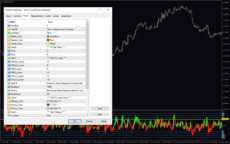
Indicator Settings
NumBars: Specifies the number of bars used to calculate the price.
useExtern: Enables or disables the import of external variables.
Bullish_Color: Determines the color used to indicate a bullish bar in the indicator.
Bearish_Color: Determines the color used to indicate a bearish bar in the indicator.
Actual_Color: Determines the color used for bars that are neither bullish nor bearish.
Wick: Specifies the length of the candlestick wick.
Body: Specifies the length of the candlestick body.
OBHigh_Upper: Sets the upper limit of the overbought region.
OBHigh_Lower: Sets the lower limit of the overbought region.
NMid_Upper: Sets the upper limit range for prices.
NMid_Lower: Sets the lower limit range for prices.
OSLow_Upper: Sets the upper limit of the oversold region.
OSLow_Lower: Sets the lower limit of the oversold region.
BarsBack: Specifies the number of previous bars used for calculation.
BarsAhead: Specifies the number of bars ahead used for calculation.
OBHigh_color: Sets the color for marking the overbought zone.
Normal_color: Sets the color for the normal zone.
OSLow_color: Sets the color for the oversold level.
useAlerts: Enables or disables the alerts.
numLevels: Specifies the number of levels allowed by the indicator.
level1-6: Specifies the value of the 1-6 levels of the indicator.
exitSig: Calculates the exit point.
Conclusion
In conclusion, the Value Chart Deluxe Indicator is a powerful tool for Forex traders seeking to enhance their technical analysis and make informed trading decisions. By providing a visual representation of price movements, indicating trend directions, and gauging trend strength, this indicator offers valuable insights into the Forex market. Incorporating the Value Chart Deluxe Indicator into your trading strategy can improve your decision-making process, increase the accuracy of your trades, and ultimately enhance your overall trading performance.

Reviews
There are no reviews yet.