Features of the Volatility Ratio Indicator
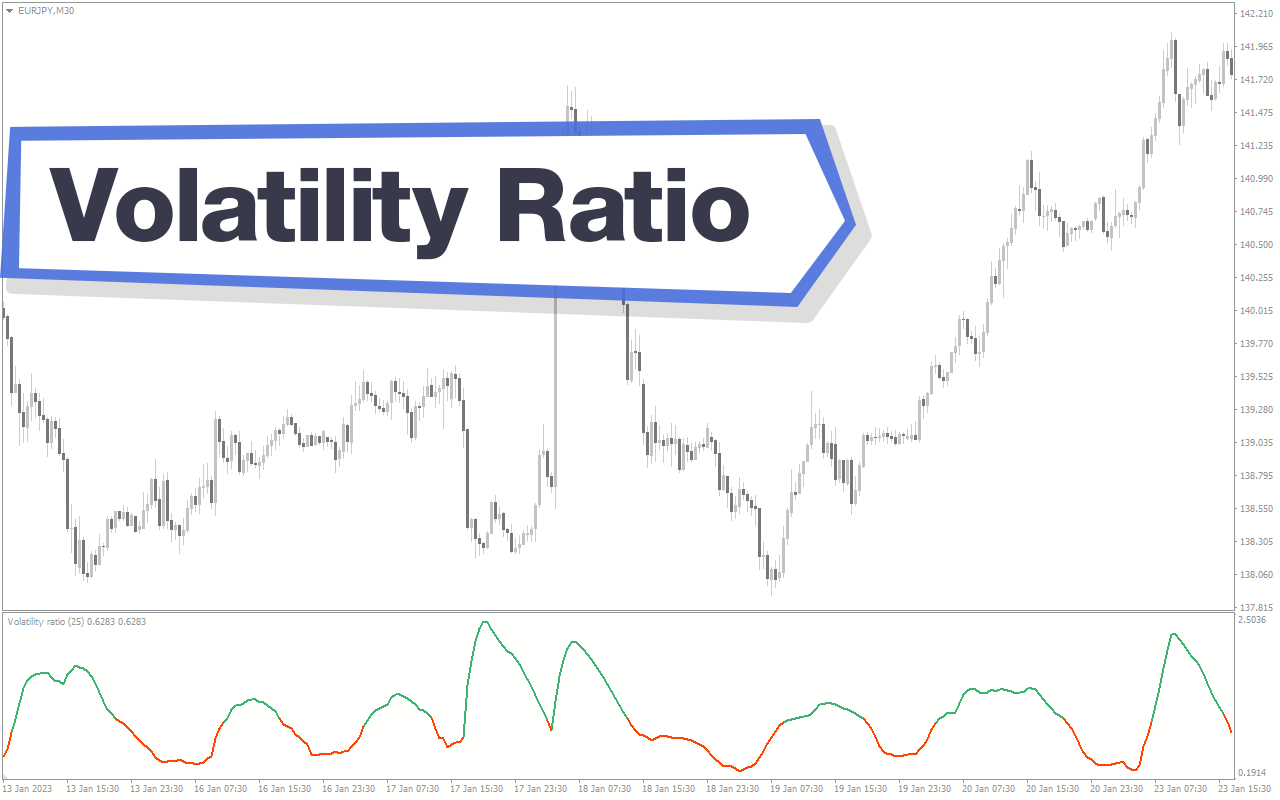
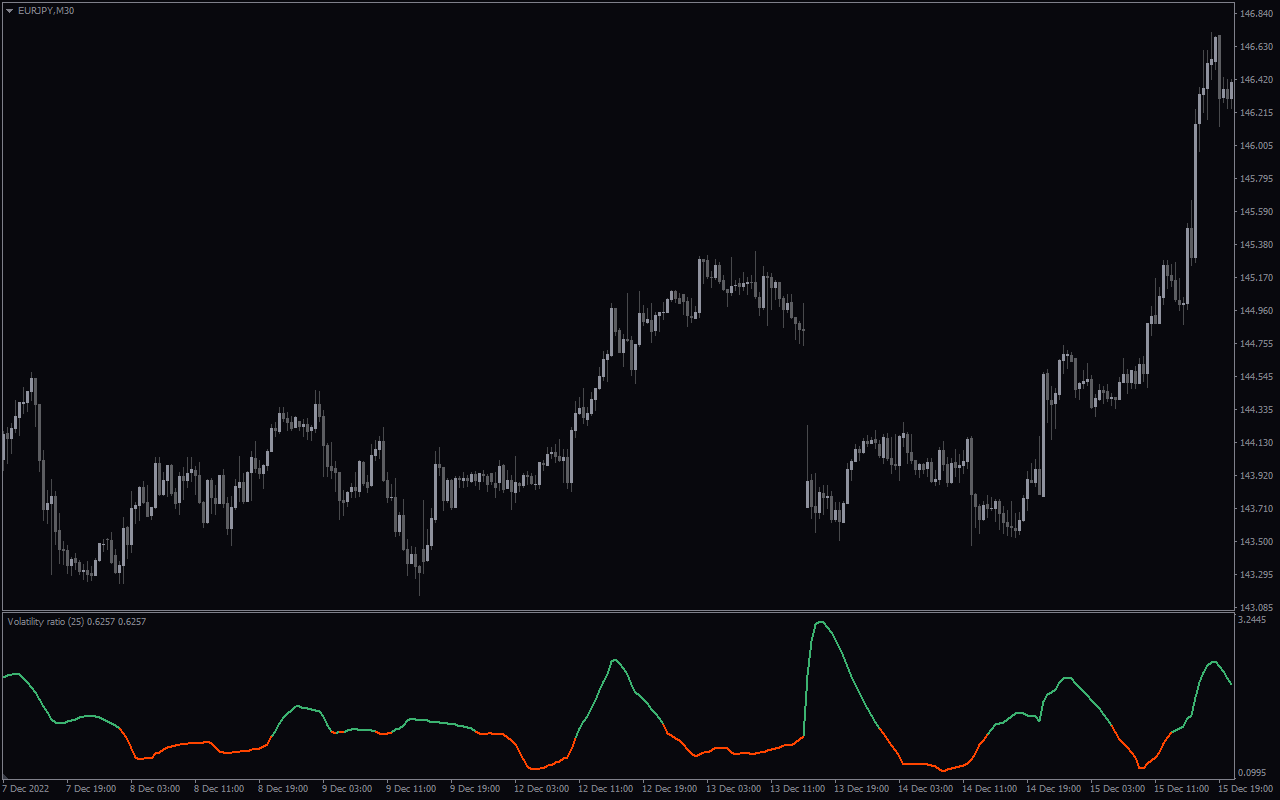
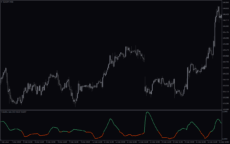
The volatility Ratio indicator shows traders whether or not the market is volatile. It draws a single line that keeps changing in color. The indicator is simple to read and can be used by both new and experienced traders on any timeframe.
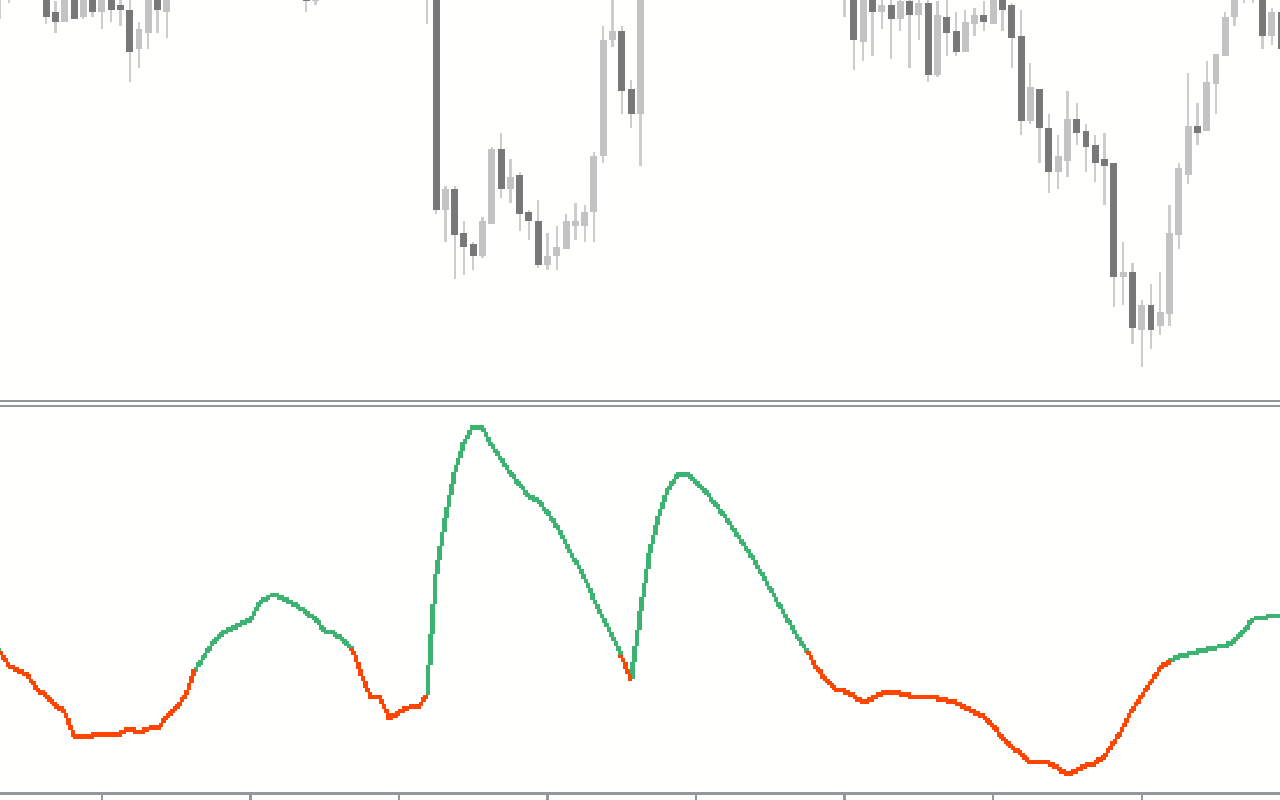
When the indicator turns green, it shows the presence of volatility. This indicates that prices have made a big deviation from the average price. On the other hand, when the indicator turns orange, it shows the absence of volatility. This shows that prices are sticking close to the average price. Therefore, there is little movement in the market.
How the Indicator Can Benefit You
The Volatility Ratio indicator can tell you the best times to enter the market for a breakout move. However, it does not give buy and sell signals. Therefore, for better results, it should be used with other tools.
Traders can look for breakouts when the market is ranging or when it is trending. However, with ranging markets, it is never clear which side the breakout should be expected. Meanwhile, in a trending market, you can expect the breakout to come in the direction of the prevailing trend.
Therefore, for a buy entry, wait for a bullish trend and enter every time the indicator changes color from orange to green. When this happens, it shows a return to high volatility, which could lead to higher prices. For a sell entry, identify a bearish trend and place your trade when the indicator turns from orange to green. This signals increased volatility that could lead to a continuation of the downtrend.
Indicator Setting Description
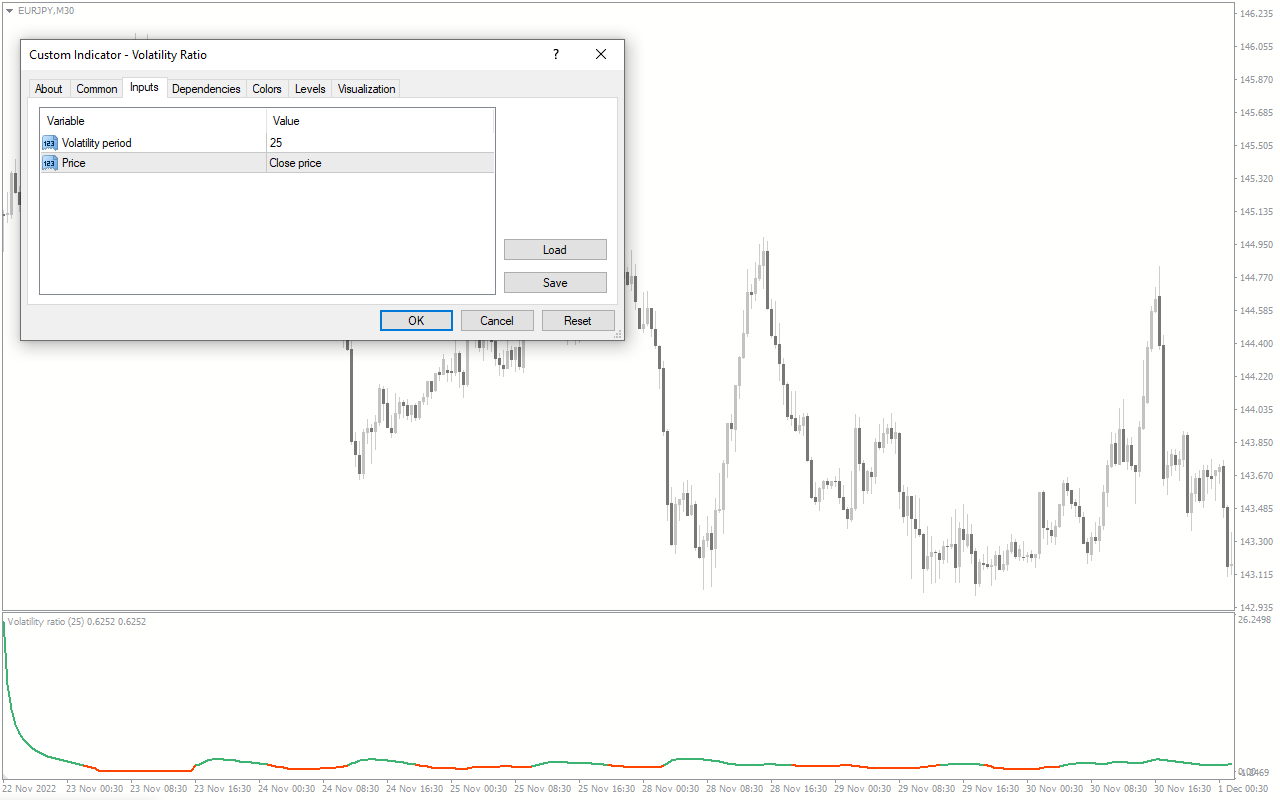
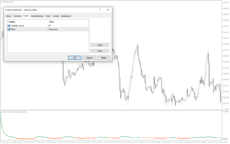
Volatility period: This input allows you to change the period the indicator uses to calculate the volatility.
Price: This input allows you to change the price the indicator uses for volatility calculation.

Reviews
There are no reviews yet.