Features of the Indicator
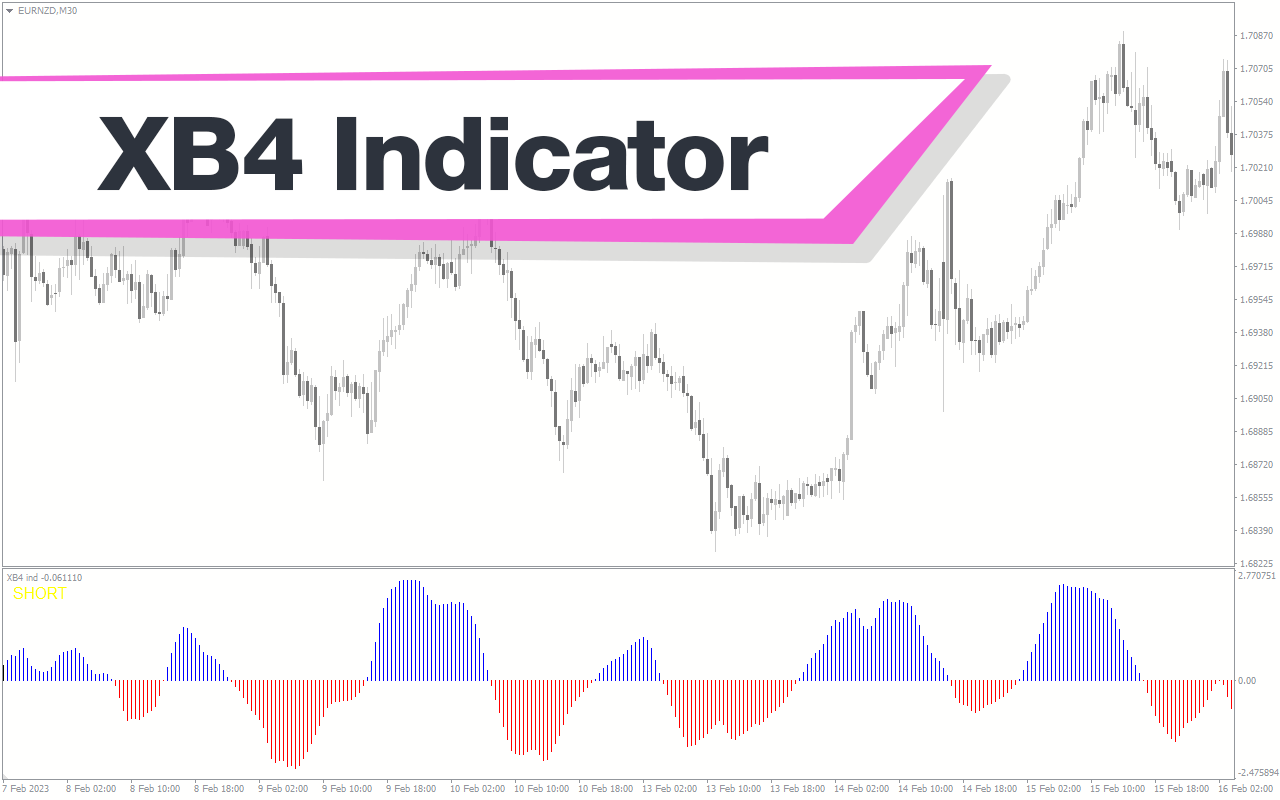
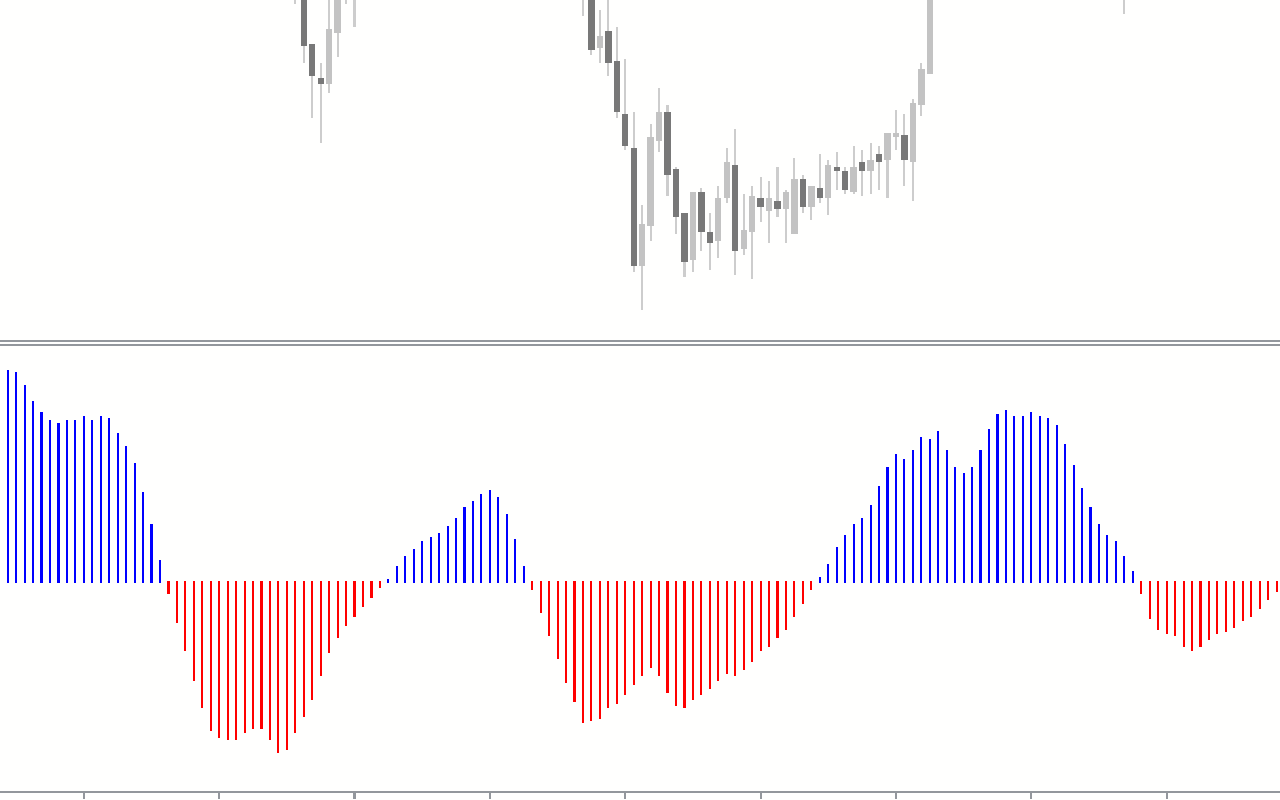
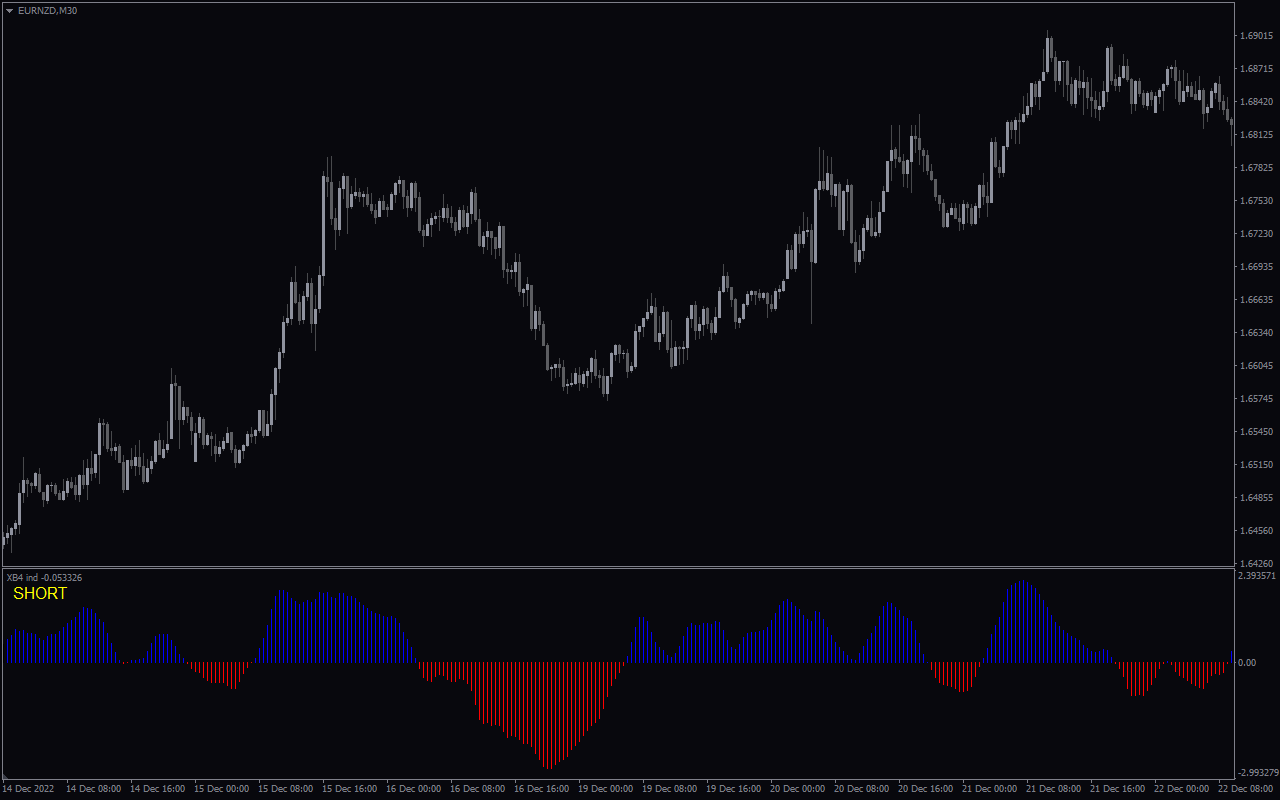
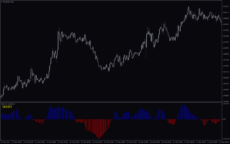
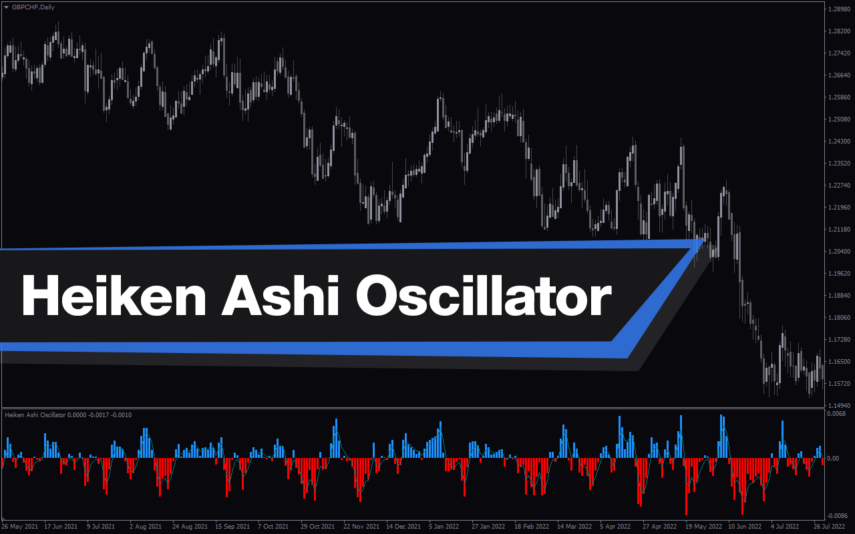
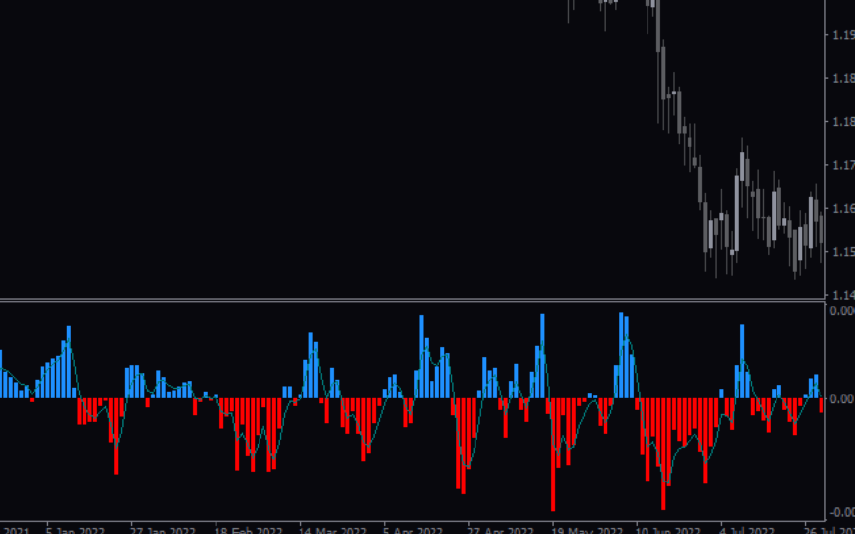
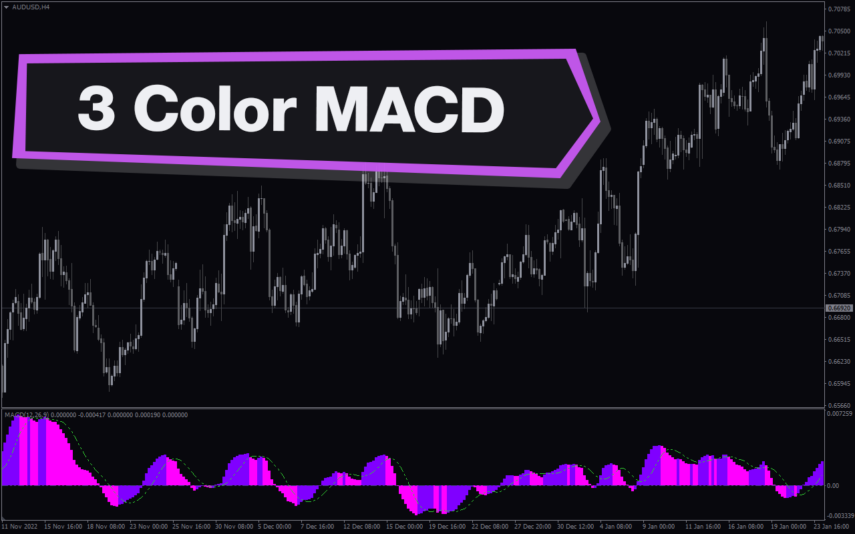
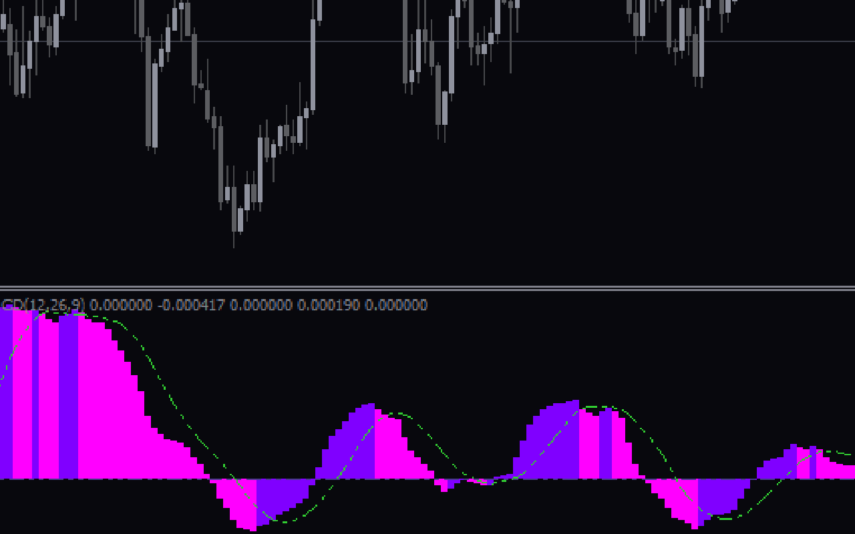
Xb4 is an easy-to-use indicator. It creates a separate window at the bottom of the chart pattern and has a histogram similar to the MACD. A 0-level line splits the indicator in half. Above this line, the indicator creates a blue histogram, and below it, a red one.
It’s a great indicator that traders of all skill levels can use. You can apply the indicator to both short-term and long-term trading. Nonetheless, it functions best for shorter periods—one hour or less. Additionally, you can trade any currency pair using the indicator.
How the XB4 Indicator Can Benefit You
The indicator provides a clear buy and sell signal. You don’t have to draw and interpret lines to get these signals. When a blue histogram appears over the 0-level line, it represents a buy signal. The strength of the uptrend increases with the histogram’s distance from the 0-level. When a red histogram appears below the 0-level line, it indicates a sell signal. When the downtrend is strong, the histogram lengthens and moves away from the 0-level line.
An ideal time to open the trade is immediately when the shift from the bottom happens and the histogram forms on the top of the line and vice versa. In other words, when it changes colour from blue to red and vice versa. Furthermore, the indicator posts a text at the left top side of the indicator window showing whether you should go short or long.
Indicator Setting Description
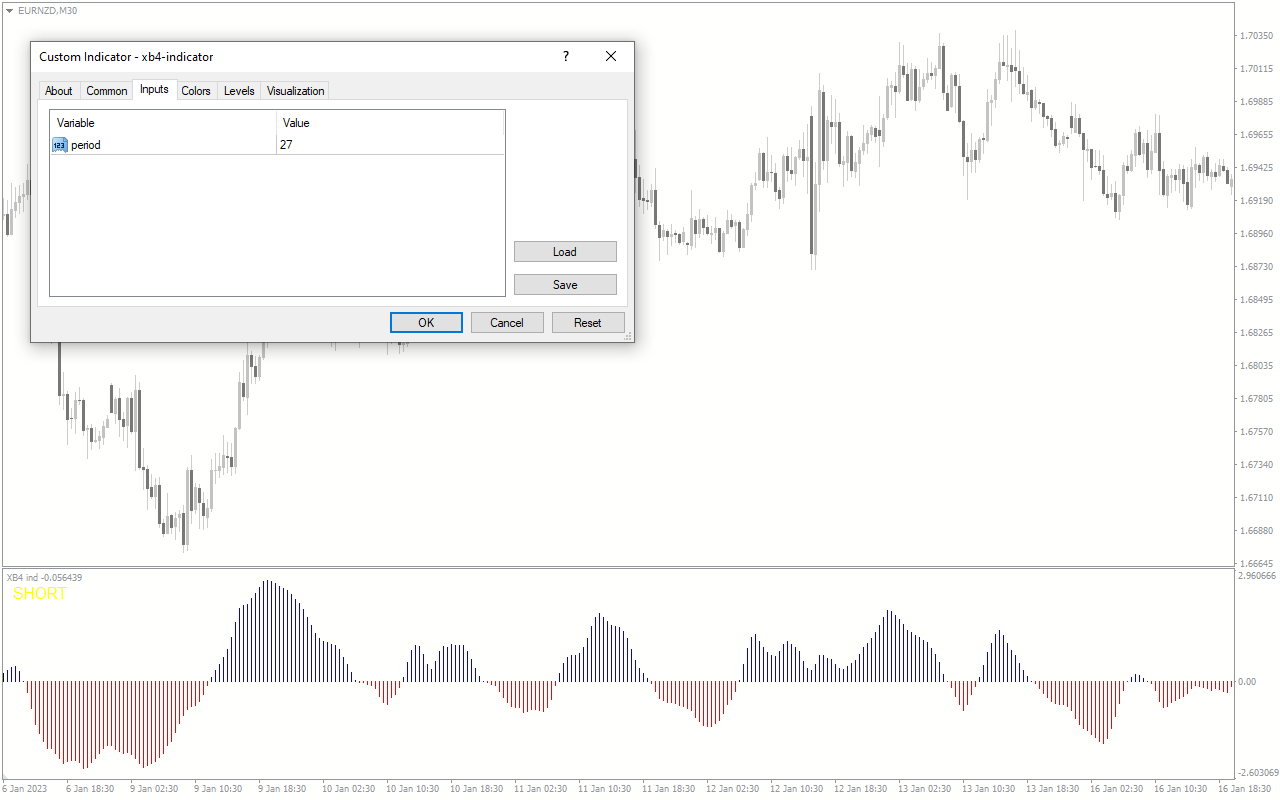
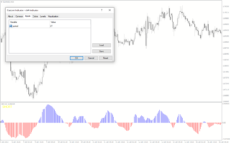
You can change the inputs to match your trading specifications.
Period: This input allows you to change the value of the indicators period.

Reviews
There are no reviews yet.