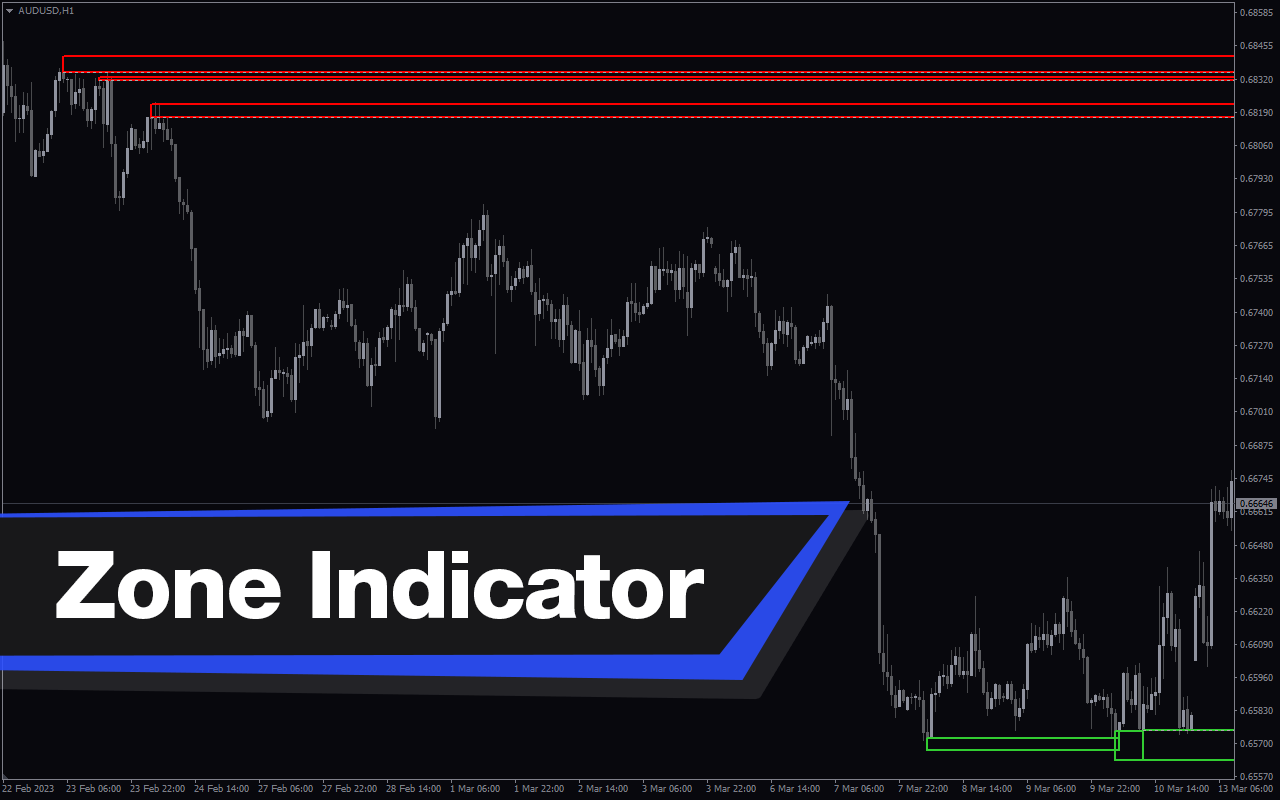
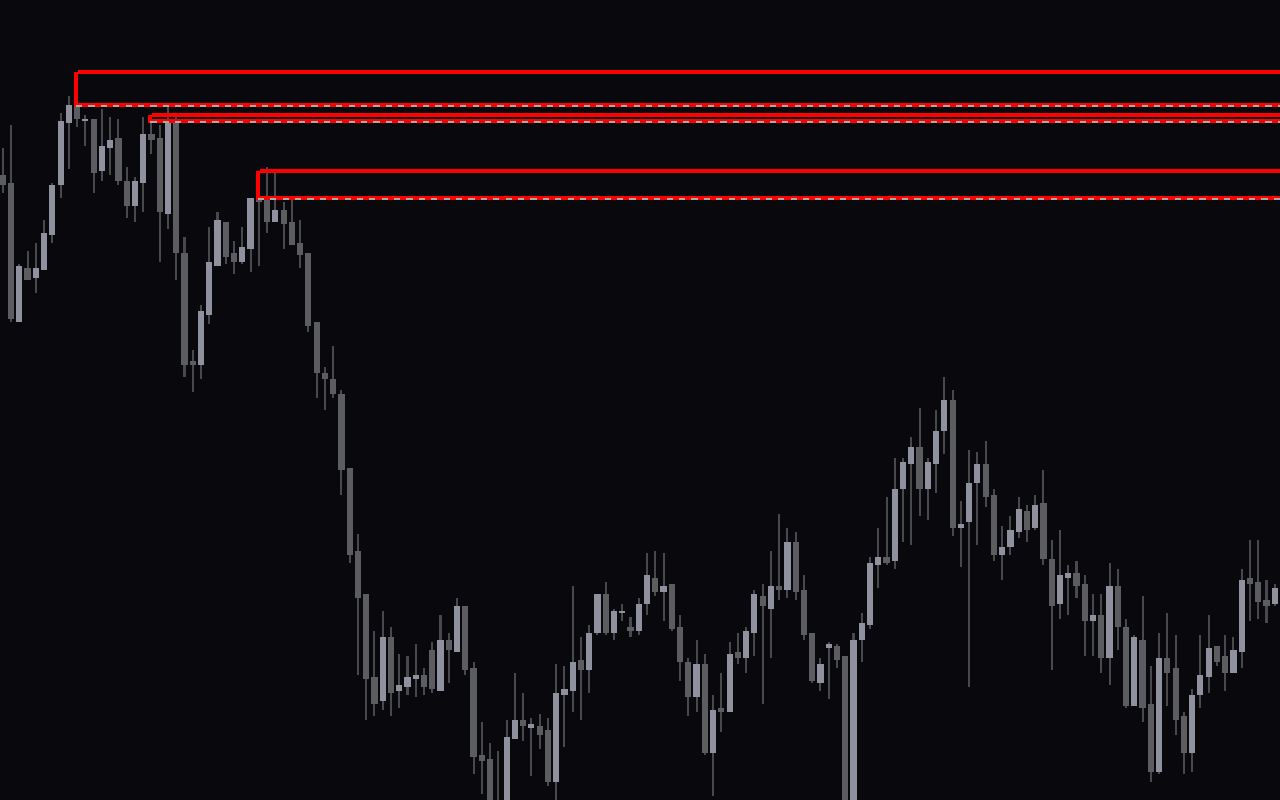
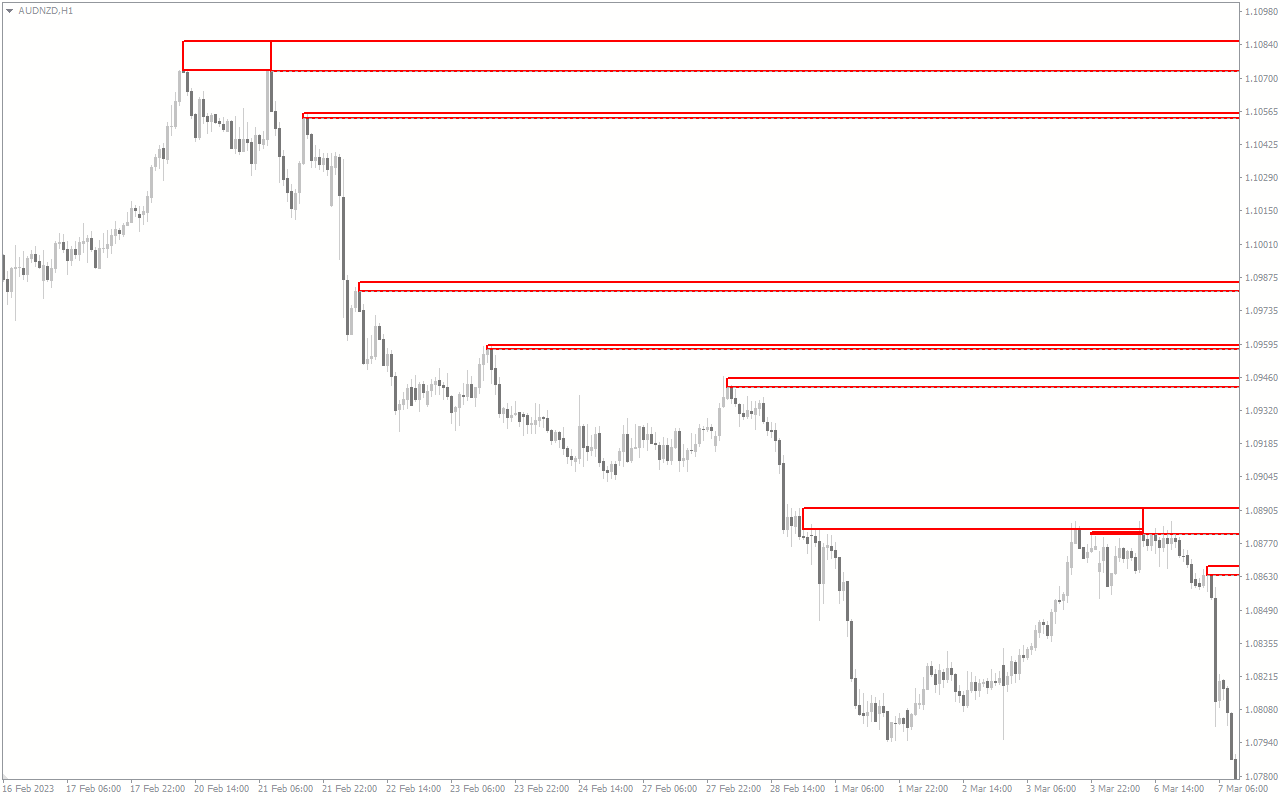
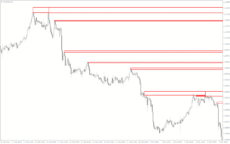
The MetaTrader Zone indicator is a valuable forex trading tool that autonomously marks significant support and resistance levels on the chart. This tool proves advantageous to those who depend on strategies centered around support and resistance and trend traders.
Features of Zone Indicator for MT4
Here are some of the features of the Zone indicator for MT4
- Automatic Support & Resistance: The Zone indicator analyzes and plots support and resistance levels on the chart. You can color code these levels to your preference.
- Simplified Analysis: The Zone indicator simplifies analysis when trading. Zone draws these levels on your chart, and you can easily incorporate them into your trading strategy.
- Versatile Strategy Integration: The Zone indicator can seamlessly fit scalping, day trading, and swing trading approaches.
- Time Frame Compatibility: You can apply the Zone indicator to any timeframe. We recommend using it on higher timeframes since it has proven more accurate there.
- Buy & Sell Opportunities: The Zone indicator provides precise entry points guided by wick rejection and candlestick patterns.
- Customizable Settings: You can tailor the indicator to your preferences for enhanced usability.
- Technical Parameters: You can adjust the indicator settings for fine-tuning. The adjustable settings include color, style, and more.
How Does the Indicator Benefit You?
The signal could prove advantageous for those of you who are in the process of understanding how to plot important support and resistance levels. Professional traders, too, can benefit as the indicator eliminates the need to draw daily support and resistance levels manually.
This MT4 indicator can seamlessly integrate into scalping, day trading, and swing trading strategies. It’s compatible with all time frames, although applying it to higher ones is suggested for enhanced precision.
The indicator provides buy and sell signals:
For a BUY opportunity:
Initially, observe the Zone indicator marking a potentially significant market level that could function as a support zone. Following this, consider entering a BUY/LONG trade when the price retraces to this support level, displays indications of rejection such as a wick and concludes with a bullish candlestick pattern.
For a SELL opportunity:
Monitor the indicator to identify a possible resistance level on your chart. Once the price retraces to this resistance level, reveals signs of rejection like a wick and closes with a bearish candlestick, you can initiate a SELL/SHORT position.
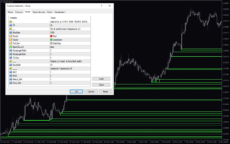
Zone Indicator Settings
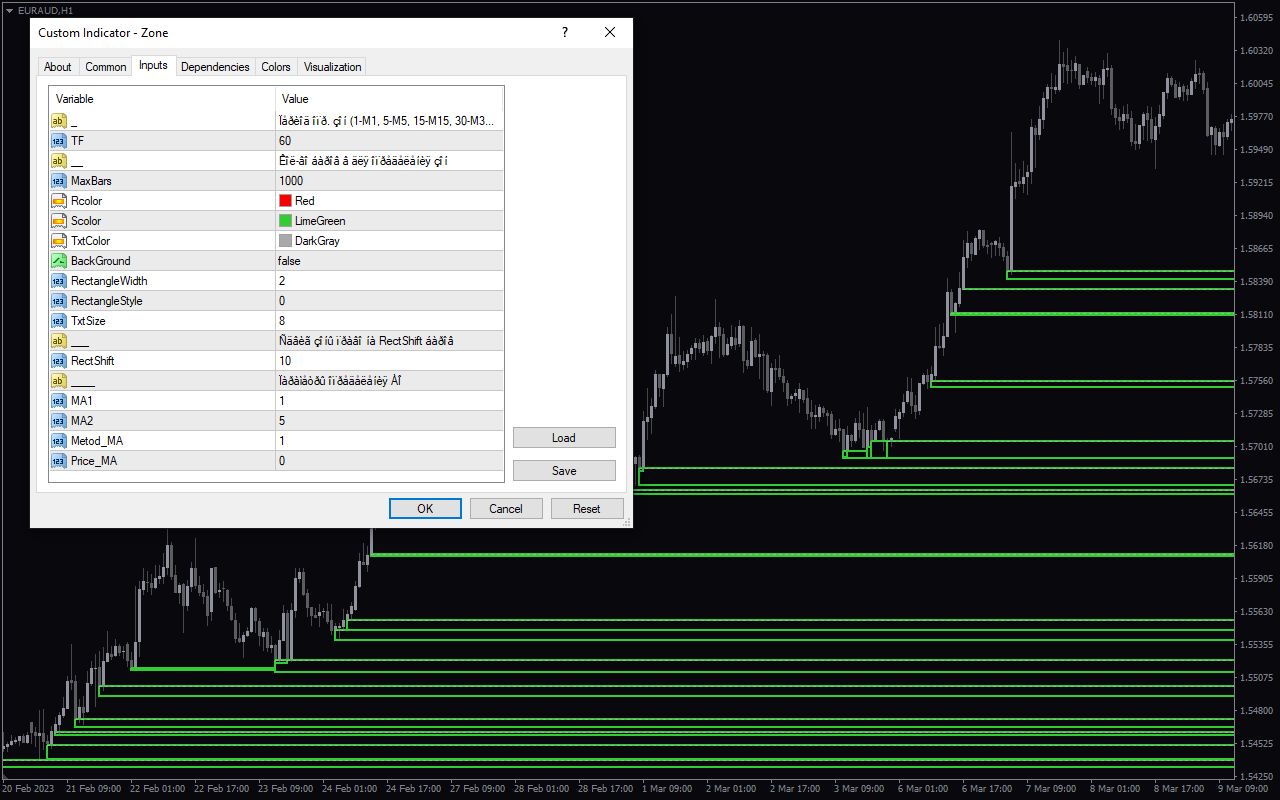
TF: Choose a TF value.
Max Bars: Choose a Max Bars value.
Rcolor: Choose a color for Rcolor.
Scolor: Choose a color for Scolor.
Background: Turn Background on or off.
Rectangle Width: Choose a Rectangle Width value.
Rectangle Style: Choose a Rectangle style value.
Txt Size: Choose a Txt size value.
Rect Shift: Choose a React Shift value.
MA1: Choose an MA1 value.
MA2: Choose an MA2 value.
Metod_MA: Choose a Metod –MA value.
Price_MA: Choose a Price –MA value.

Reviews
There are no reviews yet.