
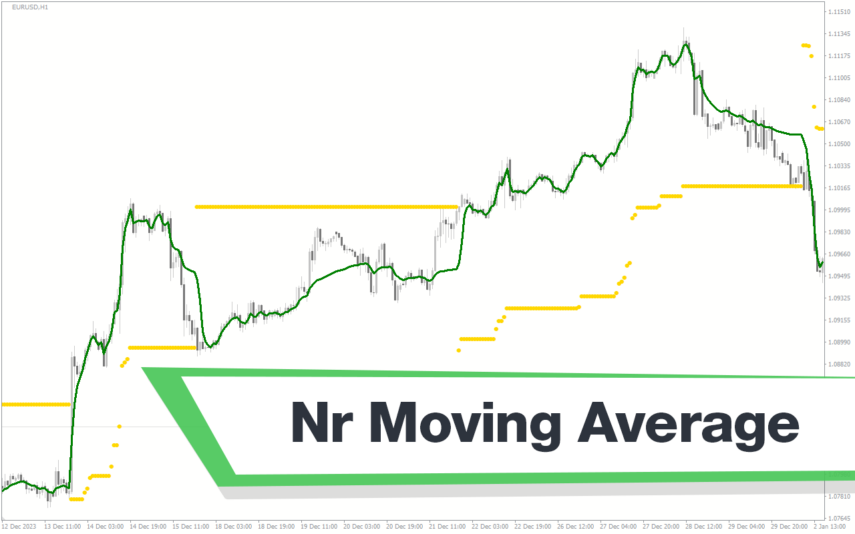
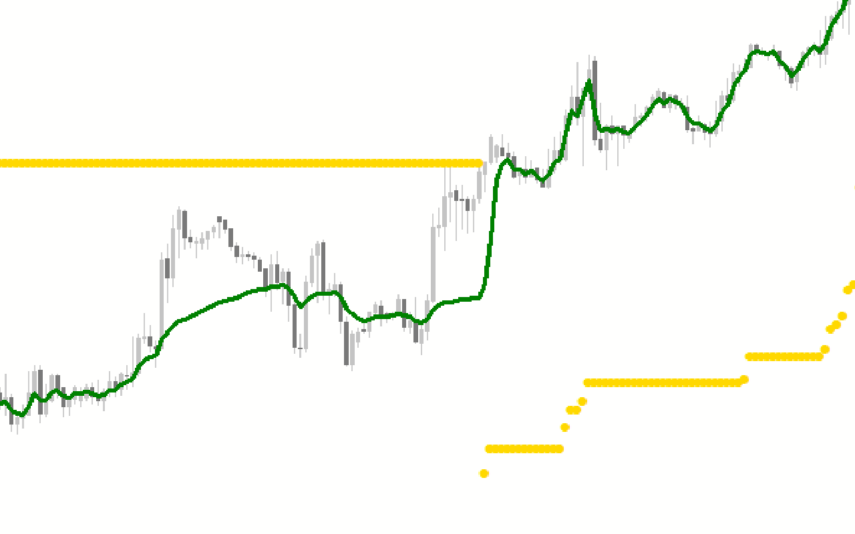
NR Moving Average
The NR Moving Average Indicator is a useful tool for forex traders looking to analyze trends in the market. This popular MT4 indicator is widely used by traders for its accuracy and ease of use. It is a free indicator that calculates moving averages based on recent price movements, helping traders make informed decisions about their trades.
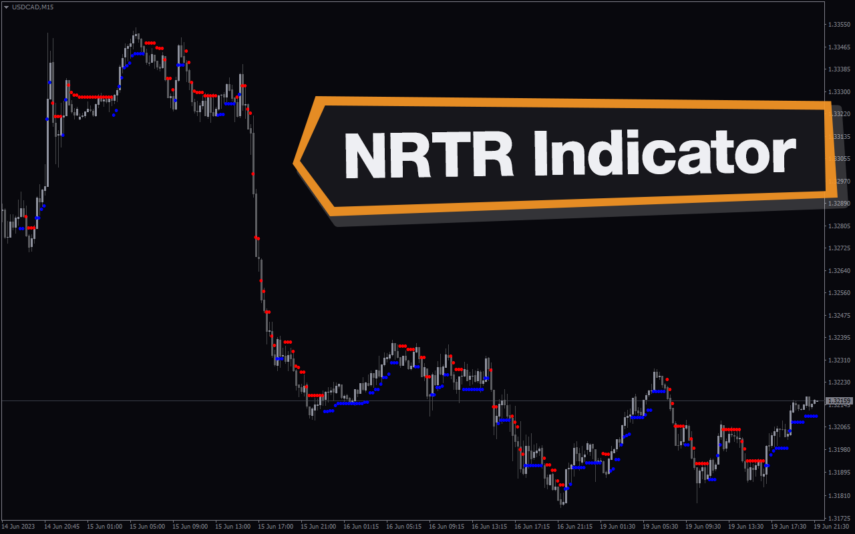
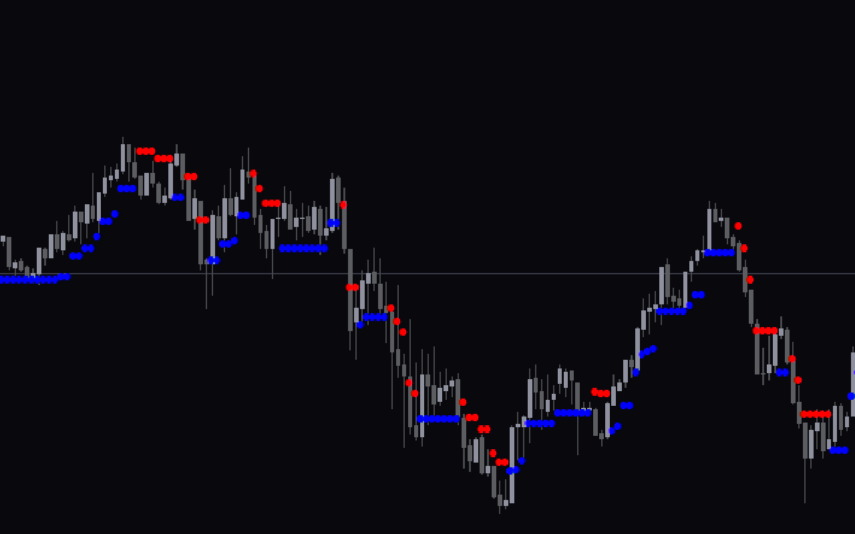
NRTR
The NRTR Indicator is a popular and free Forex indicator for MT4 and other trading platforms. This indicator is based on the NRTR (Nick Rypock Trailing Reverse) algorithm which is designed to detect and follow the price movements of the market. The indicator uses a combination of price movements, momentum, and volume to generate signals. The NRTR Indicator is easy to use and is a great tool for traders who are looking for an effective way to identify potential entry and exit points in the market.
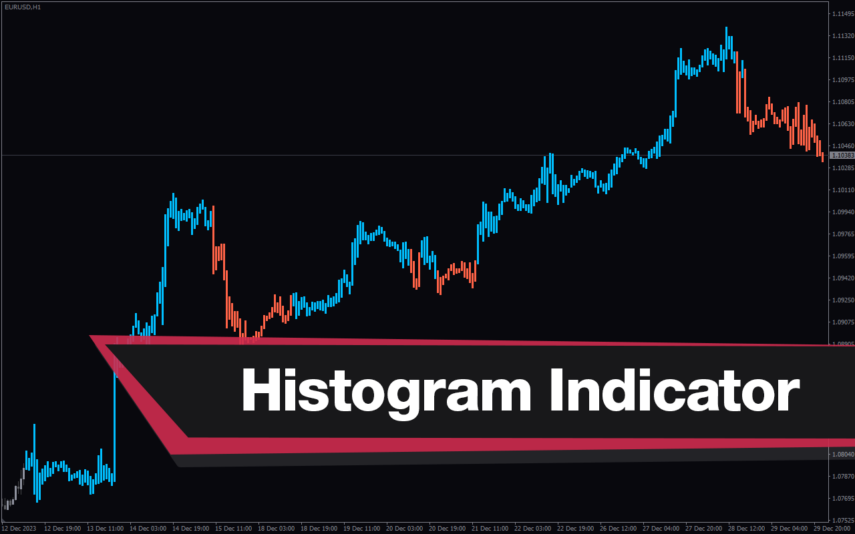
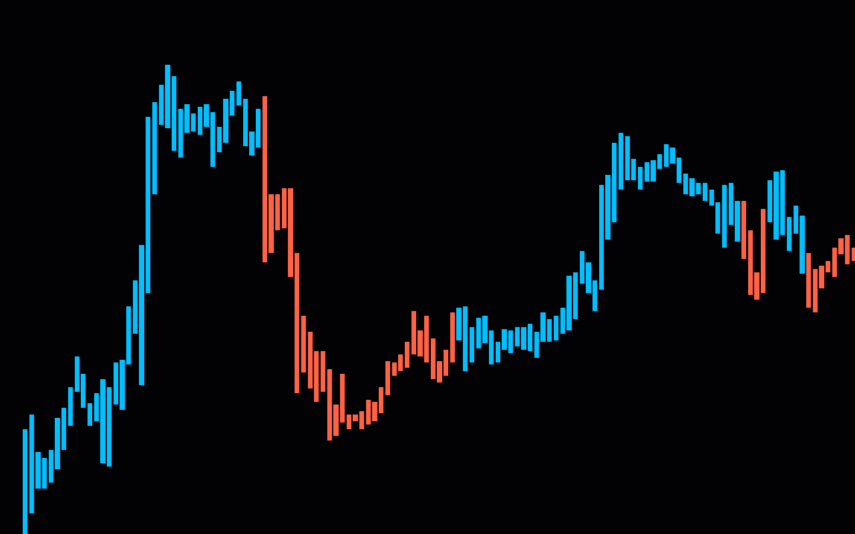
Nrtr Watr Histogram
The NRTR WATR Histogram indicator is a popular and free Forex indicator for MT4. It is designed to help traders identify price reversals and potential entry points in the Forex market. The indicator plots a histogram based on the NRTR (Nick Rypock Trailing Reverse) algorithm. The NRTR WATR Histogram indicator is a great tool for traders looking for an easy and effective way to identify potential entry points in the Forex market.
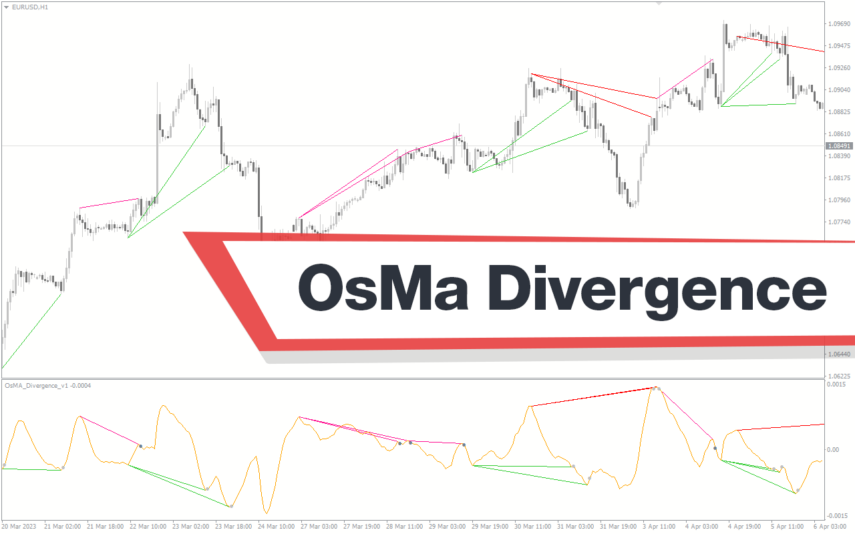
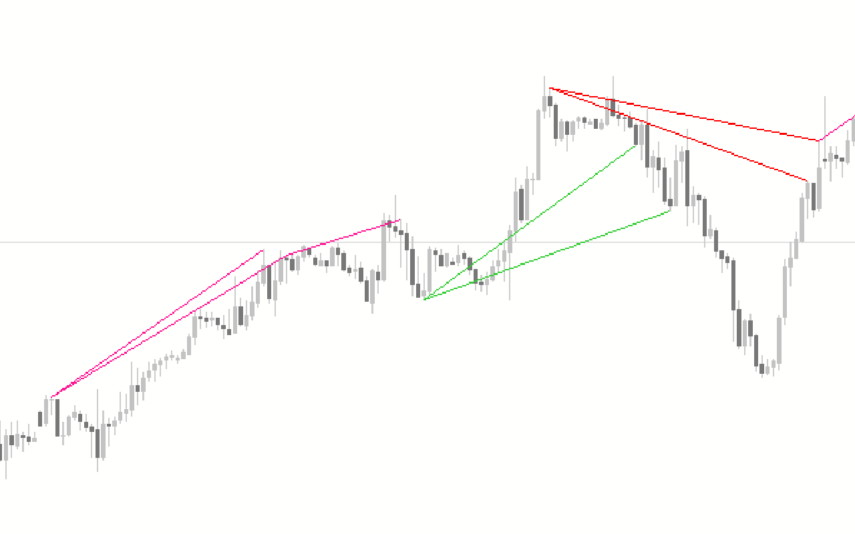
OsMa Divergence
The OSMA Divergence Indicator is a popular and free Forex indicator for MT4. It is a useful tool for traders as it helps to identify potential reversals in the market. The indicator works by plotting the difference between the oscillator and the price on the chart. If the price is moving higher while the oscillator is moving lower, it is an indication of a potential reversal. The OSMA Divergence Indicator is easy to use and can be a great addition to any trader's toolbox.
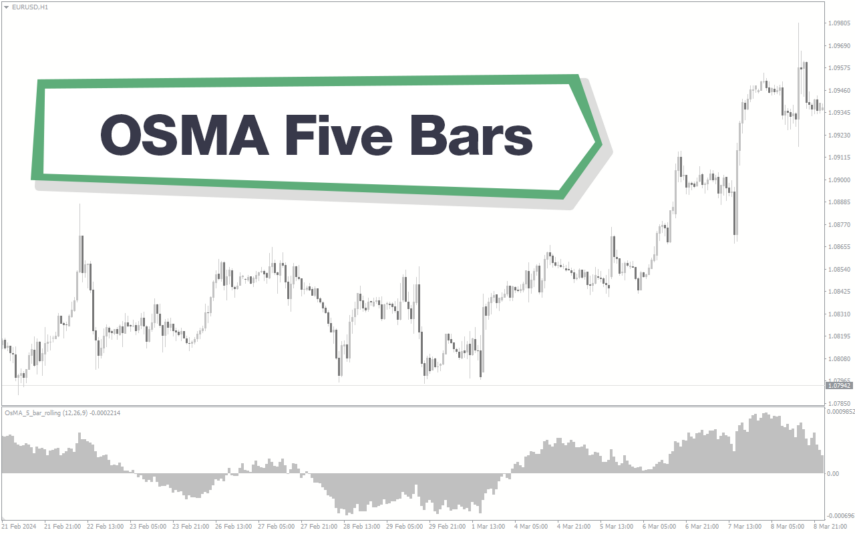
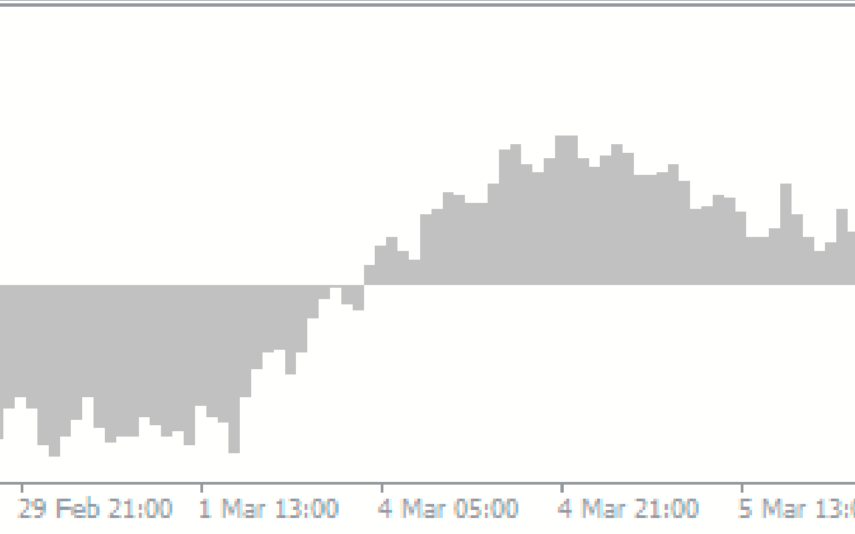
Osma Five Bars
OSMA Five Bars Indicator is a popular and useful forex indicator for MT4. It is a free tool that helps traders analyze market trends based on the Moving Average Convergence Divergence (MACD) indicator. By looking at the relationship between the signal line and the histogram bars, traders can make informed decisions about when to buy or sell.
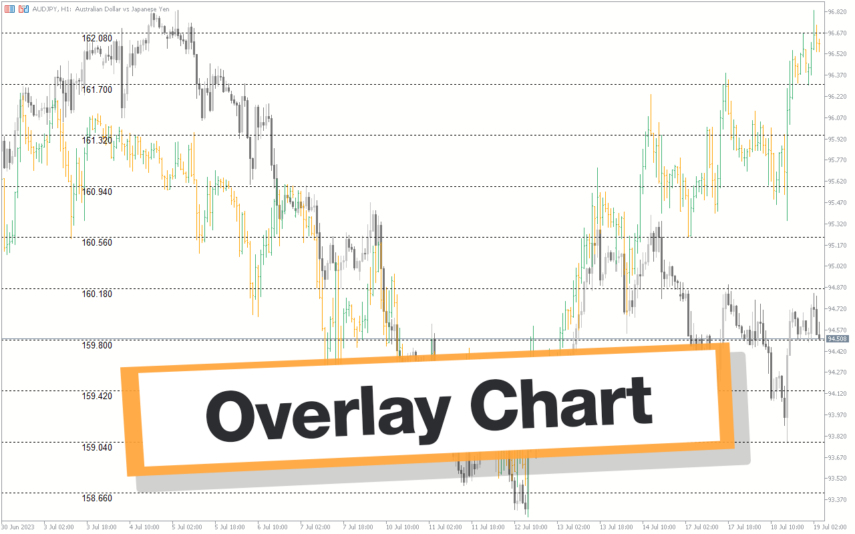
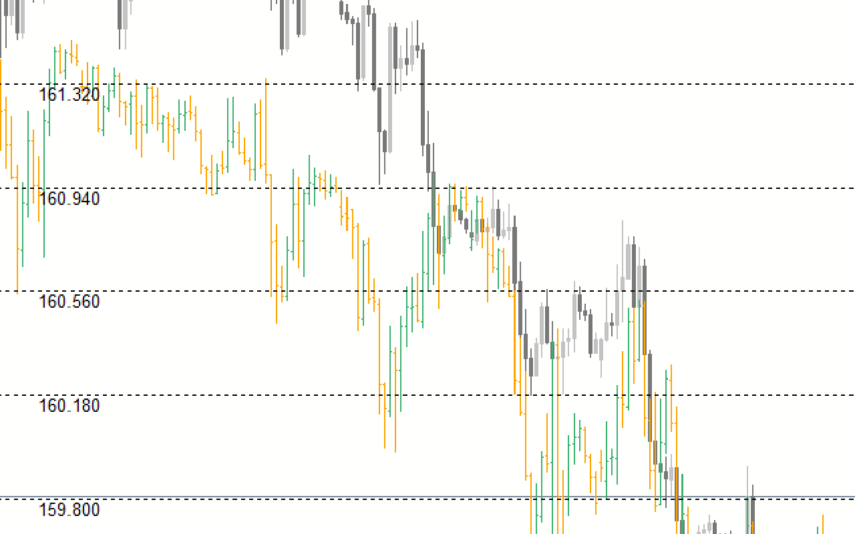
Overlay Chart
The Overlay Chart Indicator MT5 is a powerful and free Forex trading tool that helps traders make informed decisions. It uses a combination of technical indicators to overlay chart patterns on the price chart, helping traders identify entry and exit points. The indicator is easy to install and use, and it is available for free on the MT5 platform.
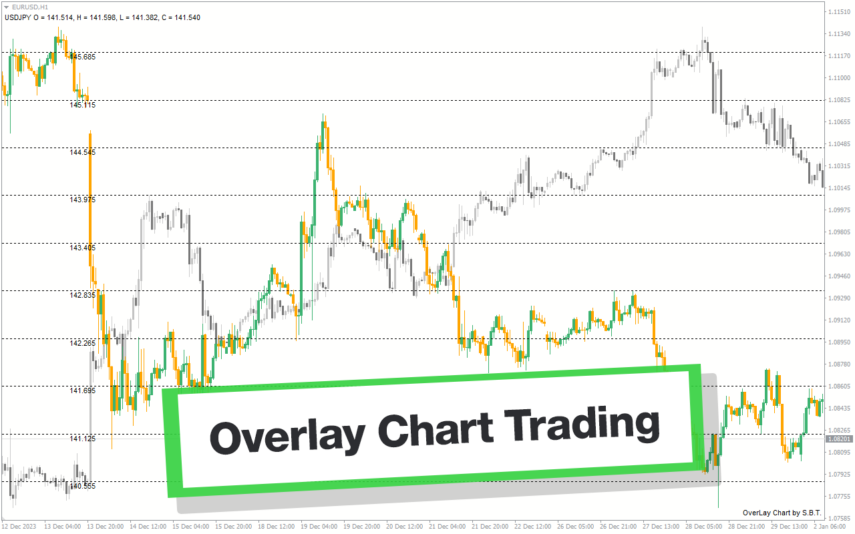
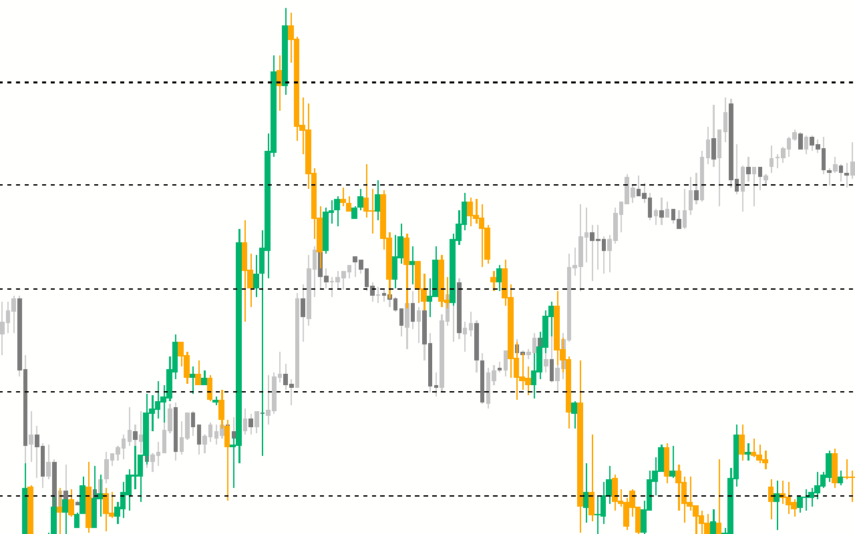
Overlay Chart Trading
The Overlay Chart Trading Indicator for MT4 is a popular and useful tool in the forex community. It is a free indicator that allows traders to overlay multiple charts on one screen, making it easier to analyze multiple assets simultaneously. Traders can use this indicator to compare different currency pairs or timeframes, helping them make more informed trading decisions.
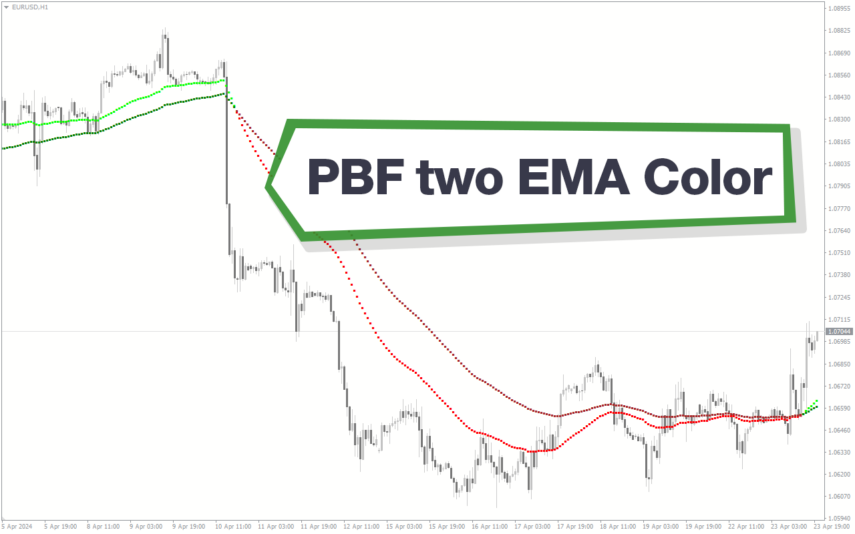
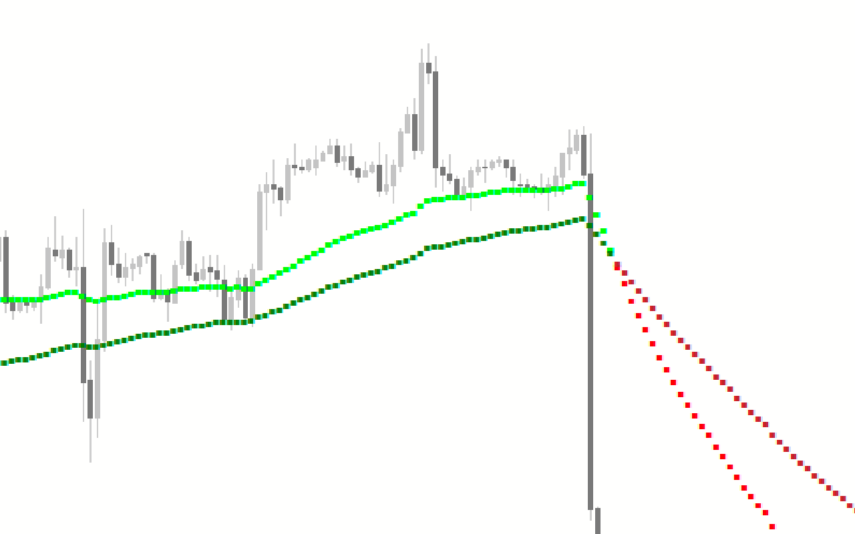
PBF Two Ema Color
PBF Two EMA Color Indicator is a popular and free forex indicator for MT4. It utilizes two exponential moving averages to provide useful insights into market trends. The indicator changes color based on the direction of the trend, making it easy to identify entry and exit points. Traders can use this indicator to make informed trading decisions in the forex market.

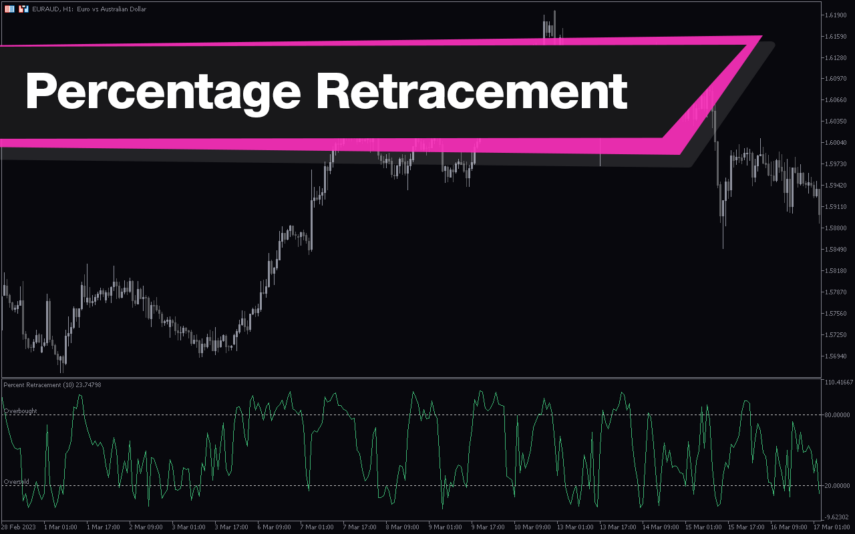
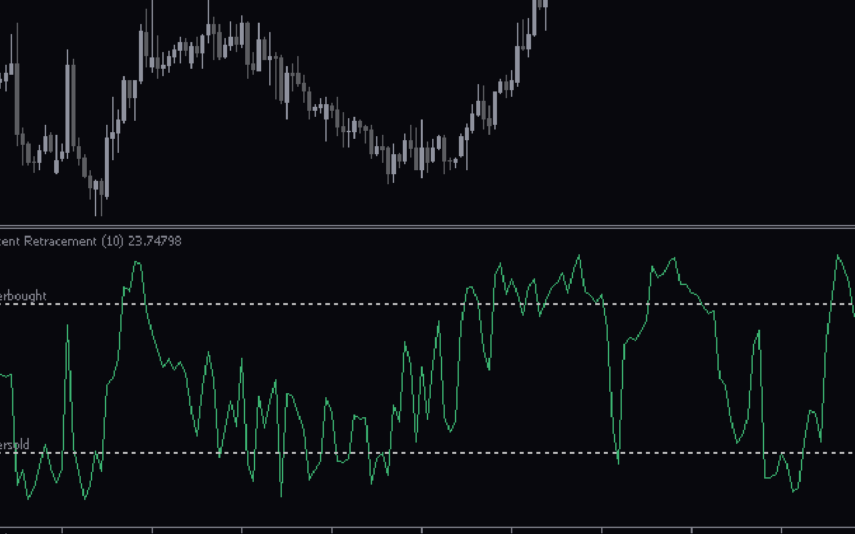
Percentage Retracement Oscillator
The Percentage Retracement Oscillator Indicator MT5 is a popular and free Forex indicator that helps traders identify potential buy and sell points in the market. This useful tool works by measuring the retracement of a price move and then plotting it against the oscillator. It then provides traders with a visual representation of when the market is overbought or oversold, allowing them to make more informed trading decisions.
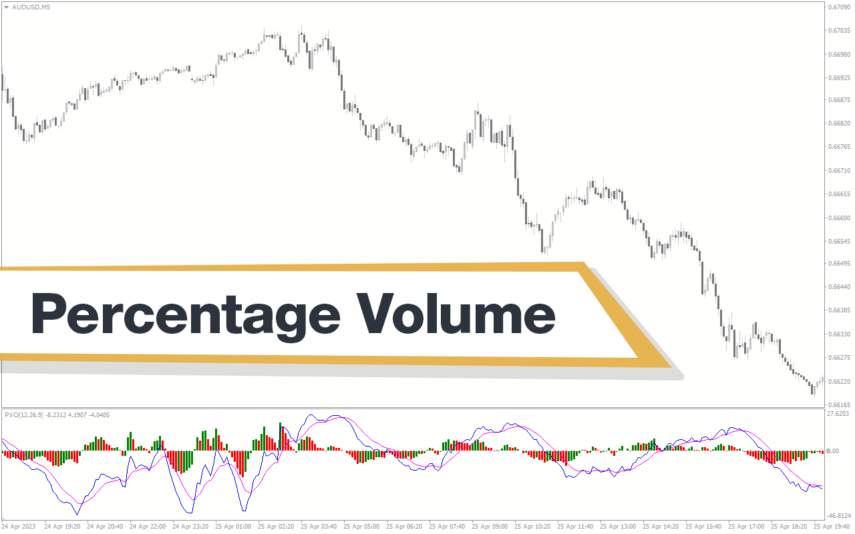
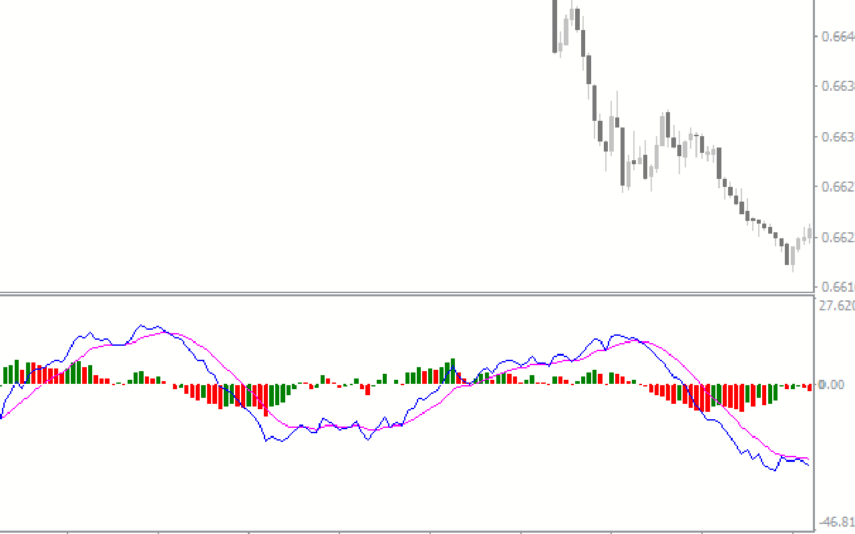
Percentage Volume Oscillator
The Percentage Volume Oscillator (PVO) is a popular and free forex indicator for the MetaTrader 4 (MT4) trading platform. It is useful in measuring the strength of a trend by comparing the volume of a particular period to the volume of the previous period. It is calculated by subtracting the 26-period exponential moving average (EMA) of volume from the 12-period EMA of volume. The PVO can be used to identify potential reversal points in the market, as well as possible breakouts and trend continuation signals.