Showing 1297–1308 of 1767 results
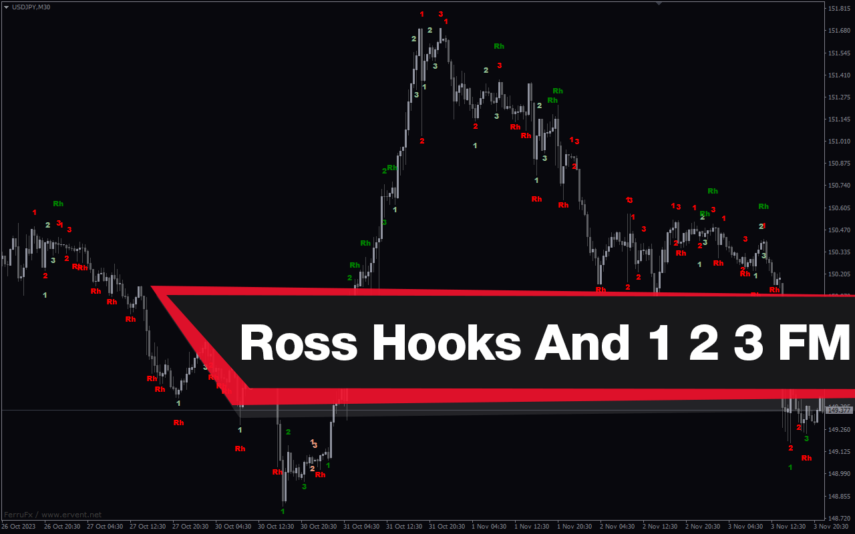
Ross Hooks And 1 2 3 Formations
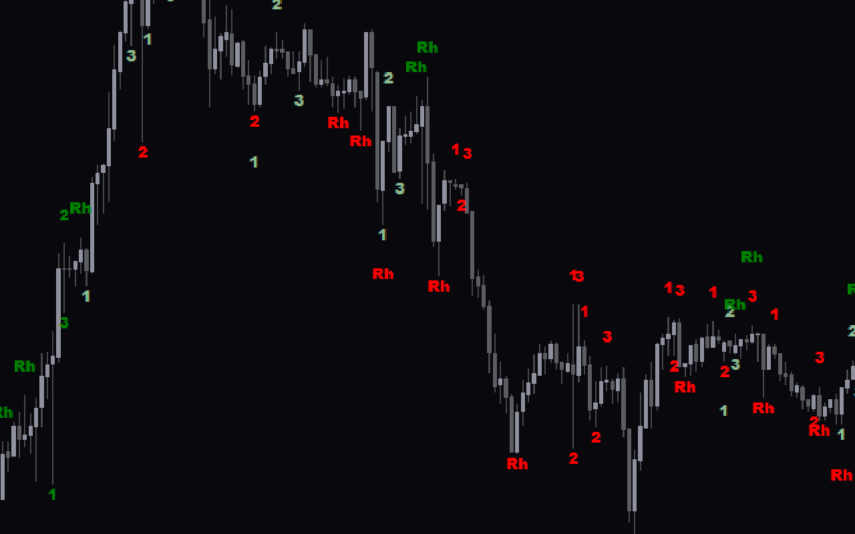
The Ross Hooks & 1-2-3 Formations Forex Indicator is a useful and popular tool for MT4 traders. The indicator displays two lines of support and resistance, which helps to determine the point of entry and exit. With the Ross Hooks & 1-2-3 Formations Forex Indicator, traders can more accurately identify and trade the 1-2-3 formation, which is a powerful reversal pattern.
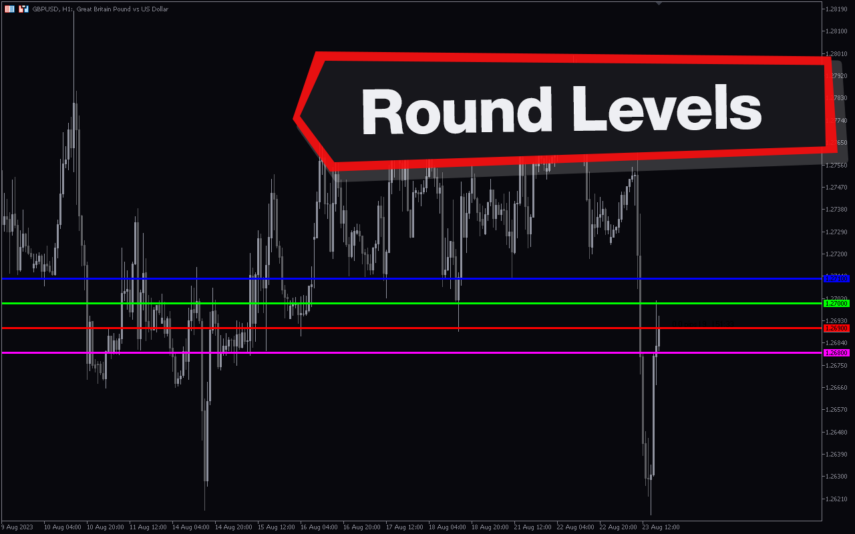
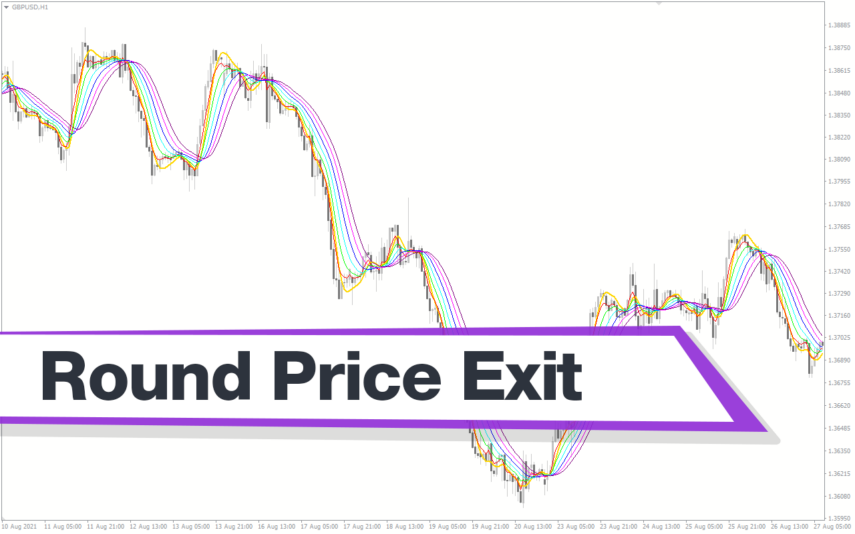
Round Price Exit
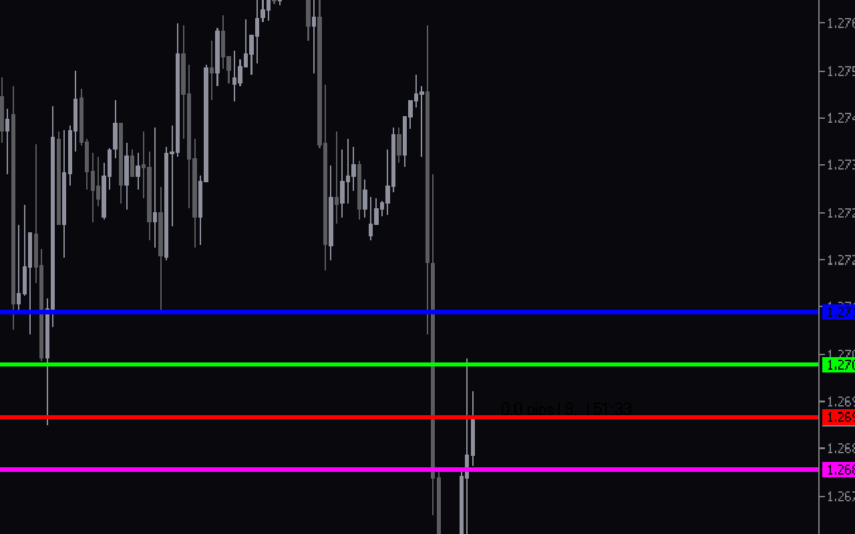
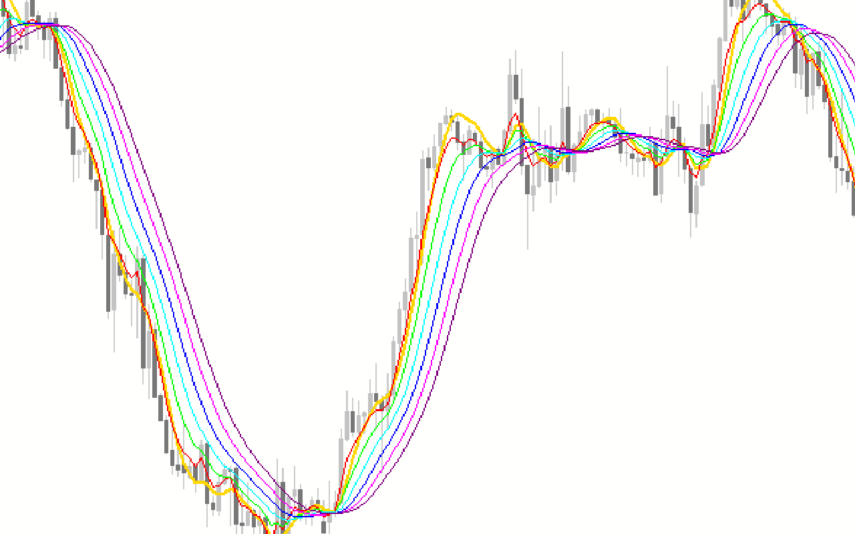
This free Round Price Exit indicator for MT4 is a very useful tool for Forex traders. This popular indicator works by drawing a line at the current price level and then plotting a line at a certain distance away from it. With this indicator, traders can easily and accurately set their exit points and maximize their profits.
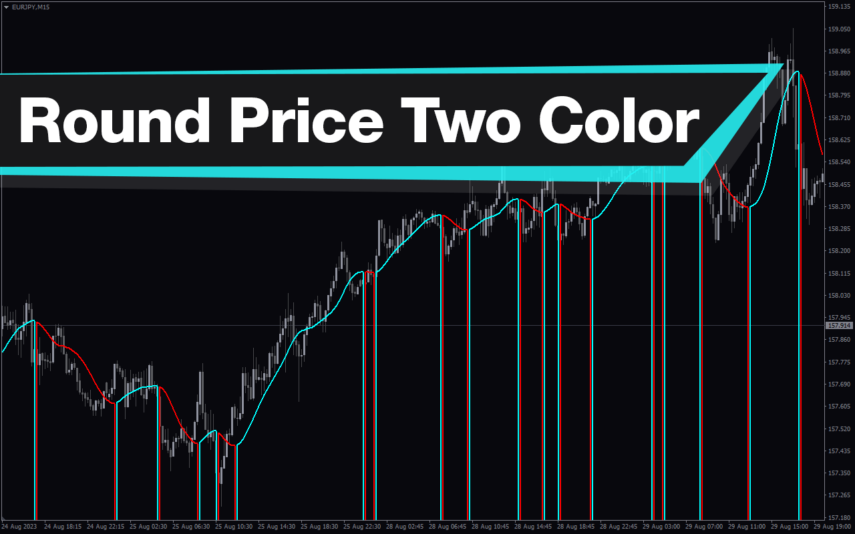
Round Price Two Color
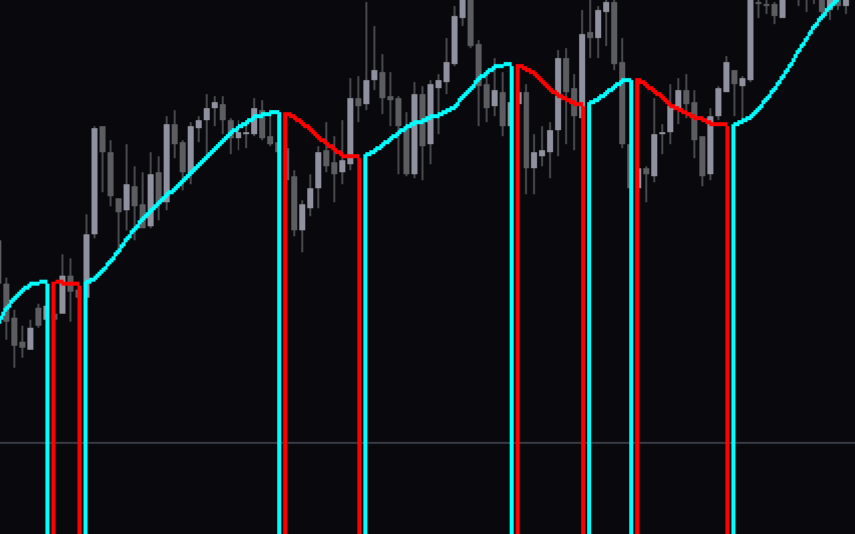
This useful free Forex indicator is one of the most popular for MT4 users. The Round Price Two Color Indicator is a great tool for traders who want to know the current price of a currency pair in a simple and easy-to-understand format. The indicator also displays the current price as a number, which allows traders to easily compare the current price to previous prices. The Round Price Two Color Indicator is a great tool for traders who want to quickly and easily identify the current price of a currency pair.
RSI 3Tf
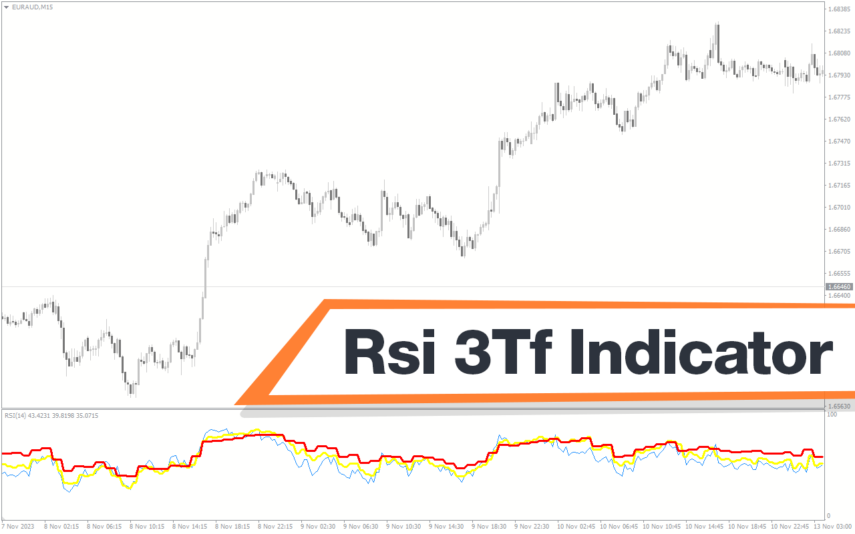
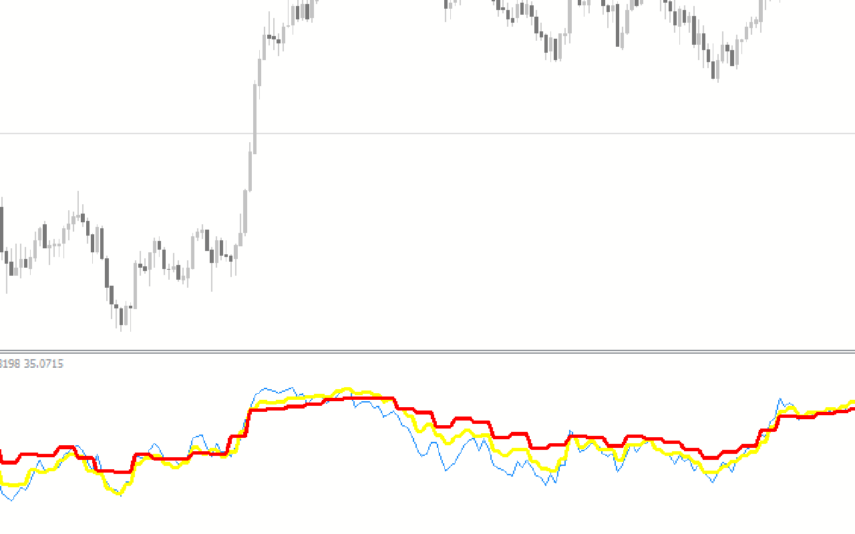
The RSI 3TF Forex indicator is a popular and free MT4 indicator that can be used to help traders identify trading opportunities in the Forex market. It is based on the Relative Strength Index (RSI) and is used to detect overbought and oversold conditions in the market. The indicator is also useful for identifying potential trading signals and can be used to help traders make informed decisions about their trading strategies.
RSI ADR Dashboard
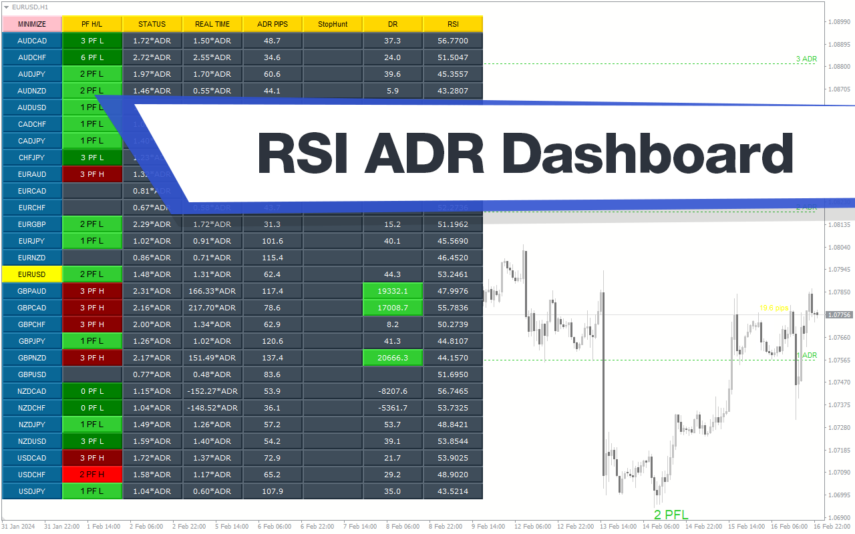
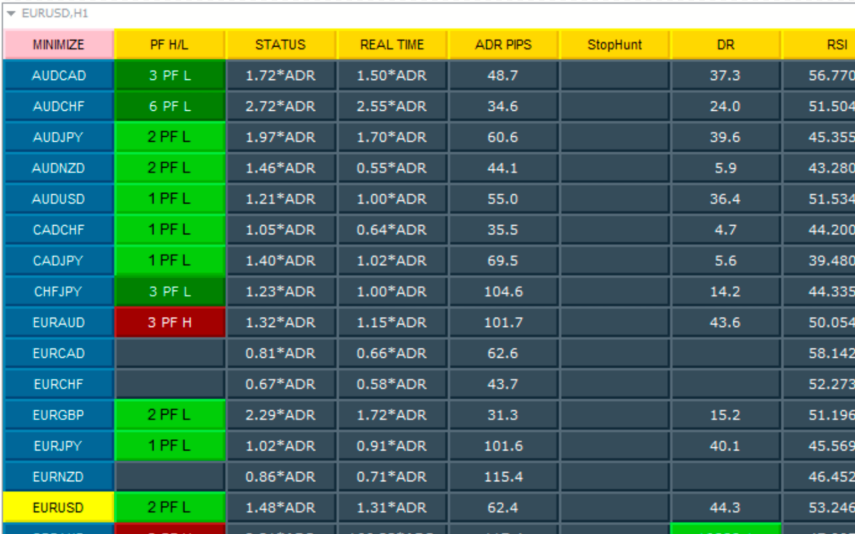
RSI ADR Dashboard Indicator for MT4 is a popular and useful forex tool that provides traders with valuable insights into market trends. This free indicator works by calculating the relative strength index and average daily range to help users make informed trading decisions. Simply install the indicator on your MT4 platform and use the dashboard to monitor multiple currency pairs simultaneously.
Rsi Bar Chart V2
RSI Bar Chart V2 Indicator is a popular and useful forex indicator for MT4. It is free to use and helps traders identify overbought and oversold market conditions. The indicator works by plotting RSI values on a bar chart, making it easy to visually analyze the strength of a trend. Traders can use this indicator to make informed trading decisions based on RSI signals.
RSI Candles
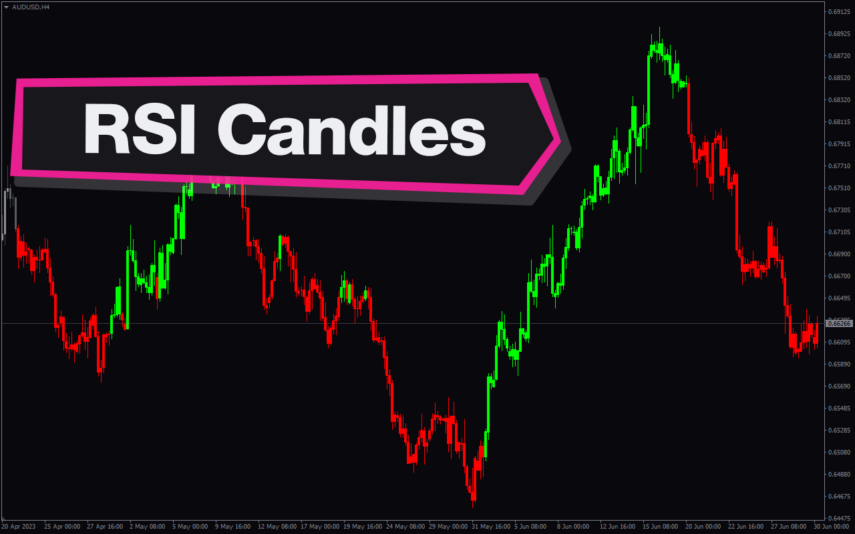
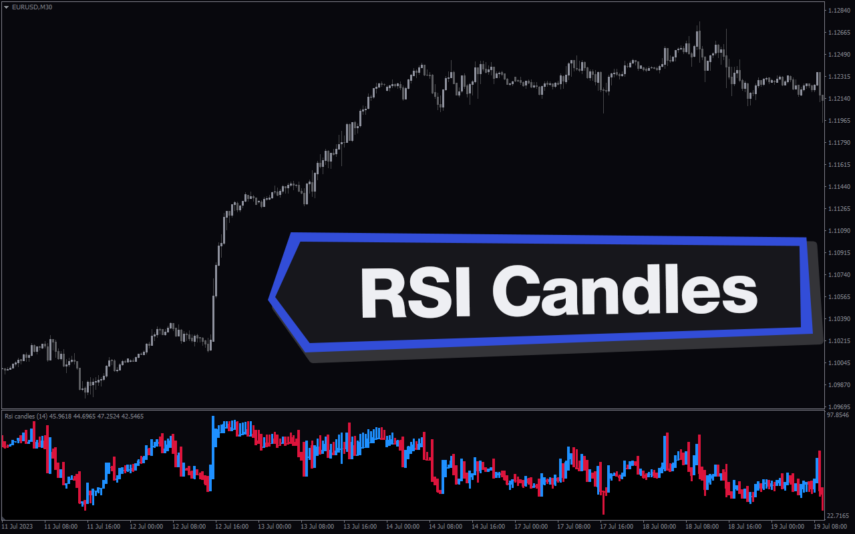
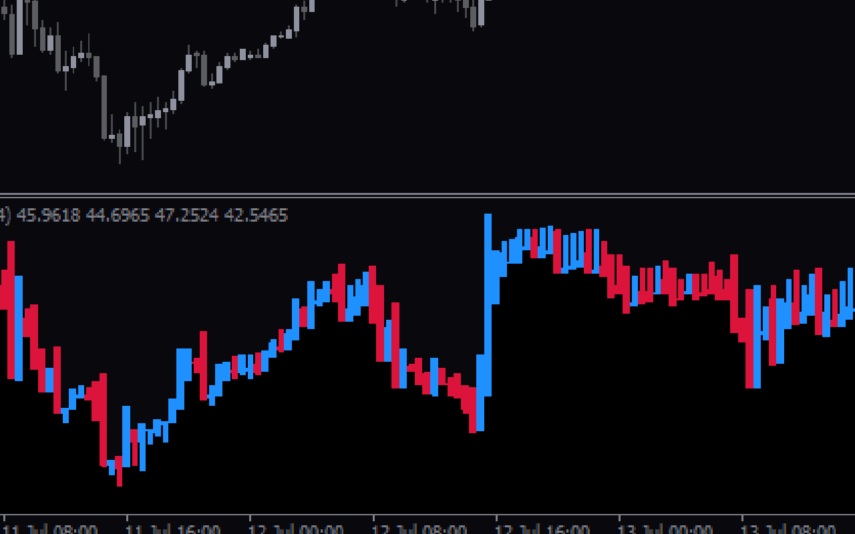
The RSI Candles Indicator is a useful and popular free MT4 Forex indicator. The indicator works by plotting a blue or red candle on the chart depending on the Relative Strength Index (RSI) values. If the RSI values are over 70, a red candle is plotted. If the RSI values are below 30, a blue candle is plotted. The RSI Candles Indicator is a great tool for any trader looking for an effective and free way to analyze the market.
RSI Candles
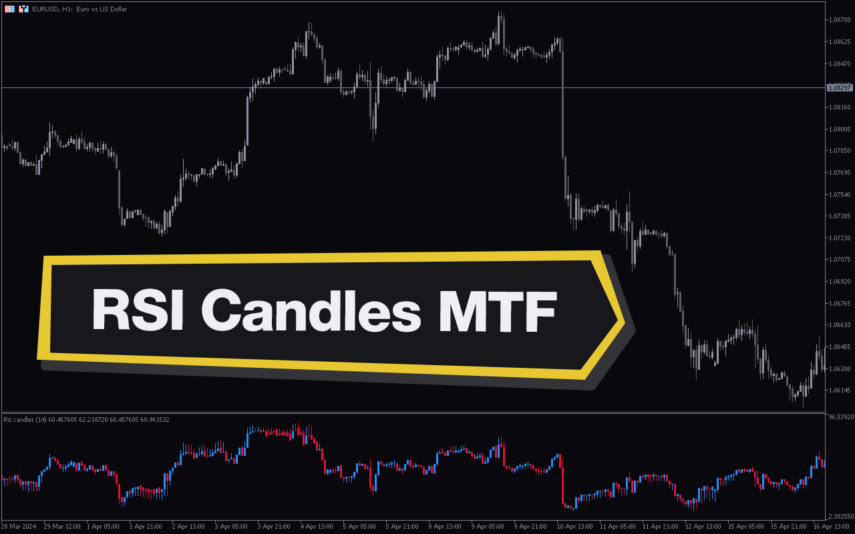
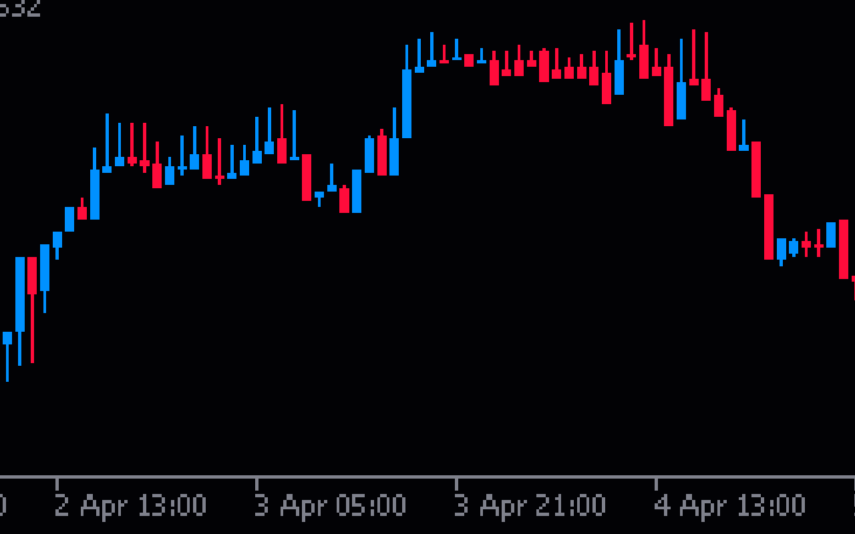
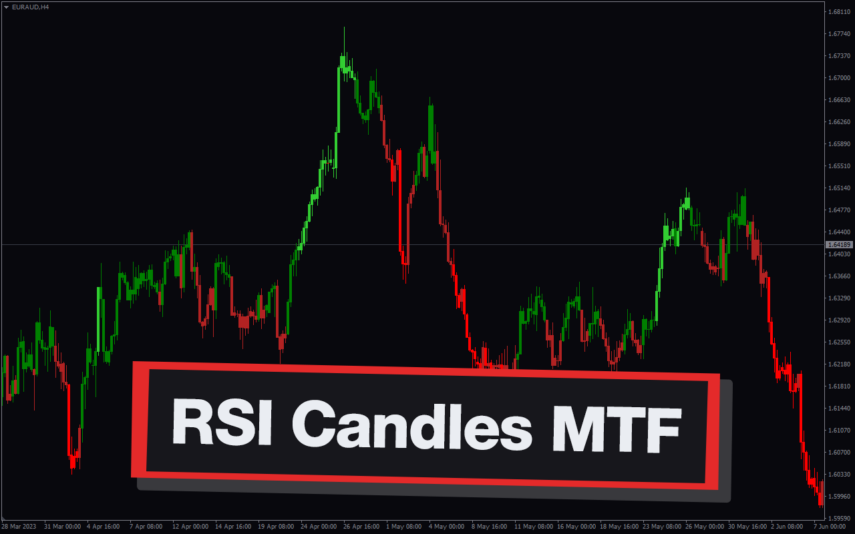
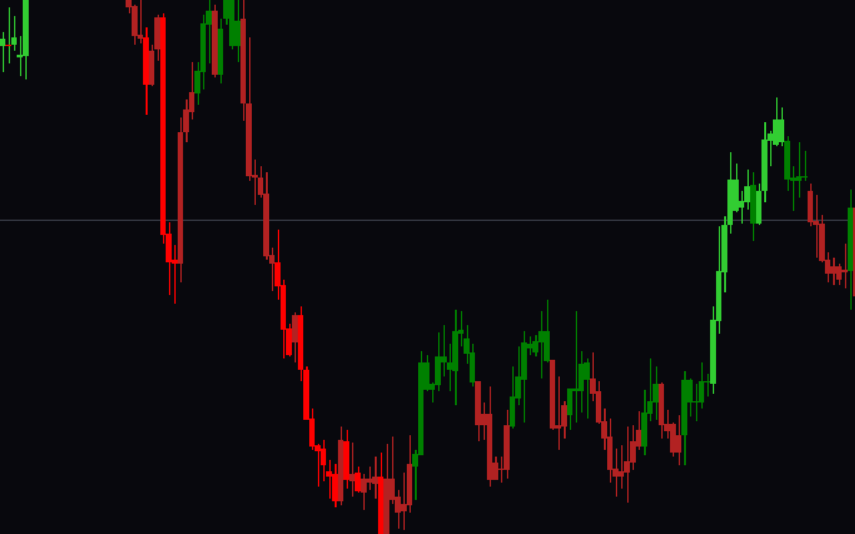
RSI Candles MTF Indicator for MT5 is a useful forex indicator that is popular among traders. It is free to use and provides multiple time frame analysis of RSI levels. This indicator works by overlaying RSI levels on candlesticks, allowing traders to quickly identify overbought or oversold conditions. Simply add the indicator to your chart and adjust the settings to suit your trading style.
RSI Candles MTF
The RSI Candles MTF Indicator is a useful and free Forex indicator for the MT4 platform. It is based on the Relative Strength Index (RSI) and displays the RSI values for different time frames in the form of candles. The RSI Candles MTF Indicator works by calculating the RSI values for different time frames and displaying them in the form of candles. The indicator can be used to identify overbought and oversold conditions in the market. The RSI Candles MTF Indicator is a useful and popular tool for Forex traders.
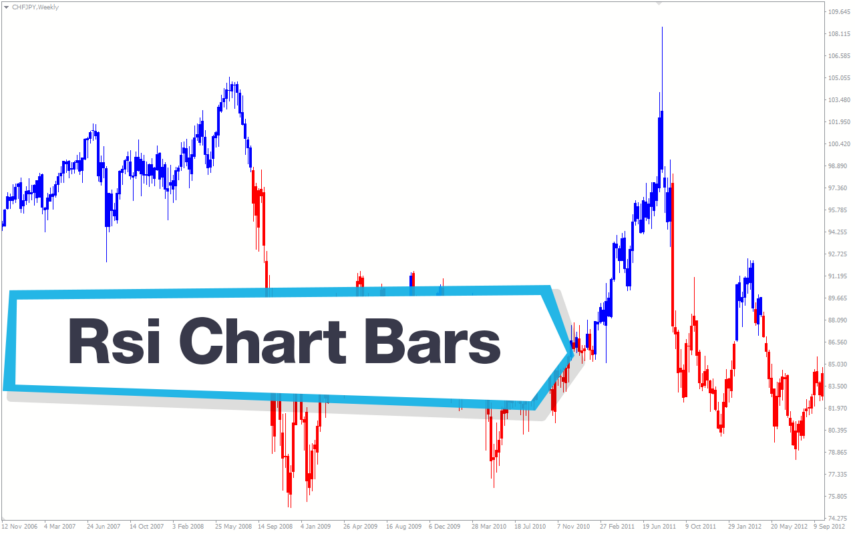
Rsi Chart Bars
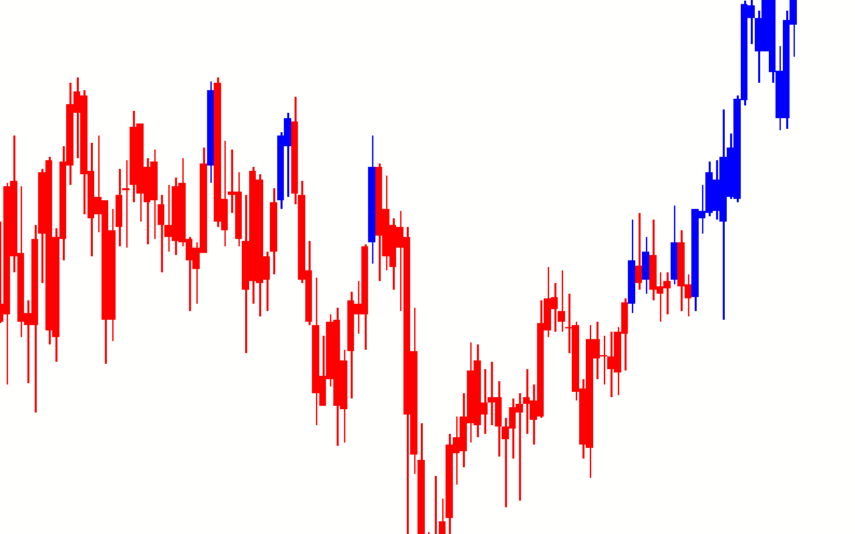
The RSI Chart Bars Indicator is a useful and popular Forex indicator for the MT4 platform. It is free to download and use, and provides a great way to identify potential trading opportunities. The indicator measures the Relative Strength Index (RSI) of the current price action and plots it as a color-coded chart bar on the chart. It is a great tool for both short-term and long-term traders, as it provides a simple way to identify when the market may be ready for a trend reversal.

